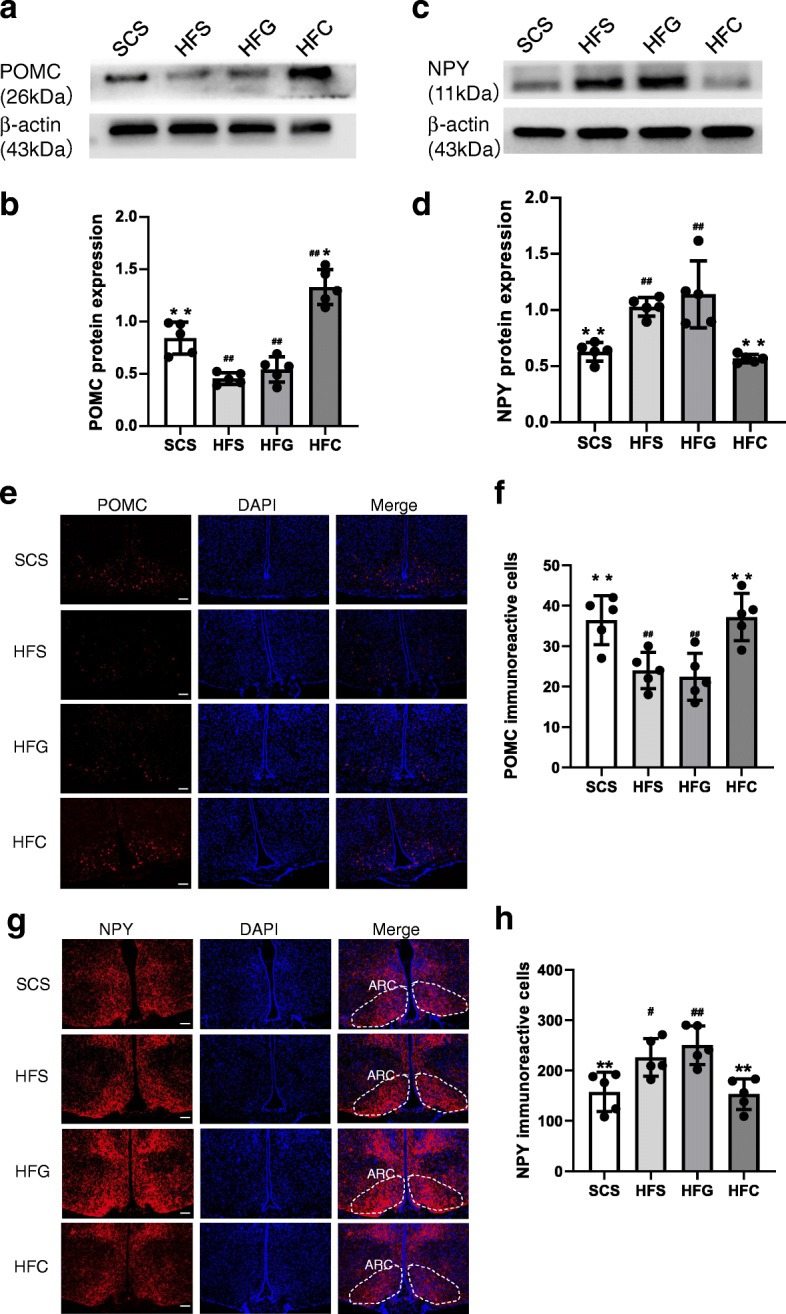
Fig. 2.

Effects of central CTRP4 overexpression on hypothalamic neuropeptides by Western blot and immunofluorescence analysis. At 72 h after i.c.v. injection, the mice receiving saline (SCS and HFS), Ad-GFP (HFG), and Ad-CTRP4 (HFC) were sacrificed, and then the hypothalami were dissected. (a-d) Representative Western blot and quantitative analysis of POMC (a-b) and NPY (c-d) in hypothalami. (e) Representative images of POMC immunoreactivity (red) and DAPI nuclear staining (blue) in the ARCs of mice among groups. (f) Densitometric analysis of POMC-immunoreactive cells among groups. (g) Representative images of NPY immunoreactivity (red) and DAPI nuclear staining (blue) in the ARCs of mice among groups. (h) Densitometric analysis of NPY-immunoreactive cells among groups. n = 5 per group. Scale bar = 25μm. Two-way analysis of variance (ANOVA) and Tukey’s test for multiple comparisons were used to analyze differences among groups. #P<0.05, ##P<0.01 vs. SCS group, *P<0.05, **P<0.01 vs. HFG group
