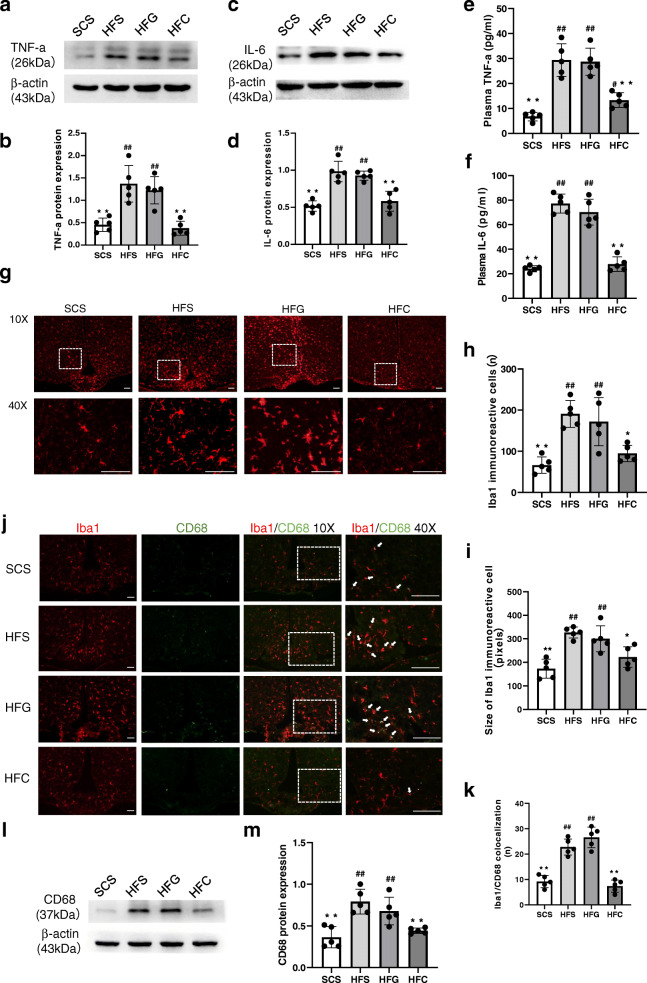
Fig. 4.
Effects of central CTRP4 overexpression on inflammatory factors and microglial activation. At 72 h after i.c.v. injection, the mice that received saline (SCS and HFS), Ad-GFP (HFG), and Ad-CTRP4 (HFC) were anesthetized, hypothalamic tissue and blood samples were collected. (a-d) Representative immunoblots and quantitative analysis showing hypothalamic TNF-α (a-b) and IL-6 (c-d) in mice among groups. (e-f) Plasma TNF-α (e) and IL-6 (f) levels were measured by ELISA. (g) Representative images of Iba1 immunoreactivity in the ARCs of mice after saline (SCS and HFS), Ad-GFP (HFG), or Ad-CTRP4 intervention (HFC). Mean ARC microglial cell number (h) (per field defined in g) and microglia cell size (i) (average number of pixels in 10 largest cells) among the different groups. (j) Immunofluorescence double labeling for CD68(green), Iba1 (red), and colocalization of Iba1/CD68 are shown. (k) Quantitative analysis of the results in panel j. (l-m) Representative Western blot (l) and quantitative analysis of CD68 expression in hypothalami. n = 5 per group. Scale bar = 25μm. Two-way analysis of variance (ANOVA) and Tukey’s test for multiple comparisons were used to analyze differences among groups. #P<0.05, ##P<0.01 vs. SCS group, *P<0.05, **P<0.01 vs. HFG group

