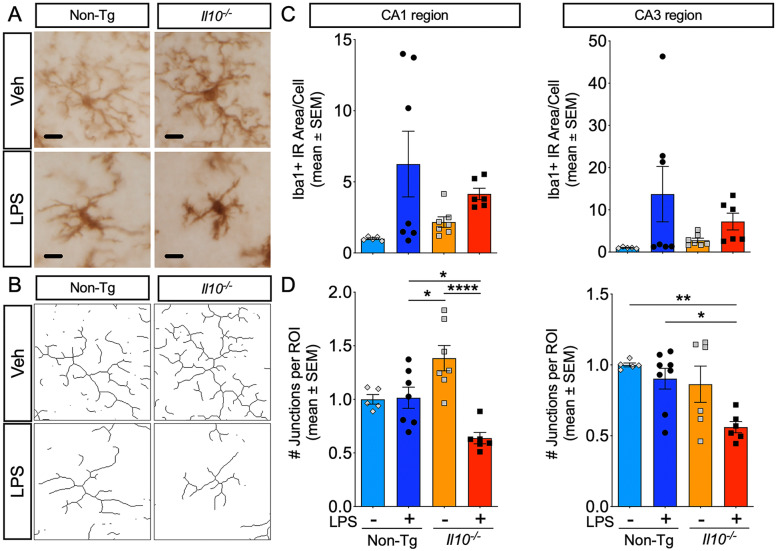
Fig. 4.
Il10 deficiency promotes a proinflammatory microglia morphology after LPS injection. IHC to visualize microglial morphology in CA1 and CA3 regions from Non-Tg or Il10−/− mice described above; 40× images were quantified; scale bar = 10 μm. A Representative Iba1+ microglia from CA1 ROI. B Representative skeletonized microglia (derived from A). C, D Quantification of Iba1+ immunoreactive (IR) area (C) and the number of junctions per ROI (D). Data shown are mean ± SEM of normalized values; * p < 0.05, ** p < 0.01; *** p < 0.001; two-way ANOVA with Sidak’s multiple comparison test; n = 5–7 mice/group. Each individual data point represents an individual mouse sample

