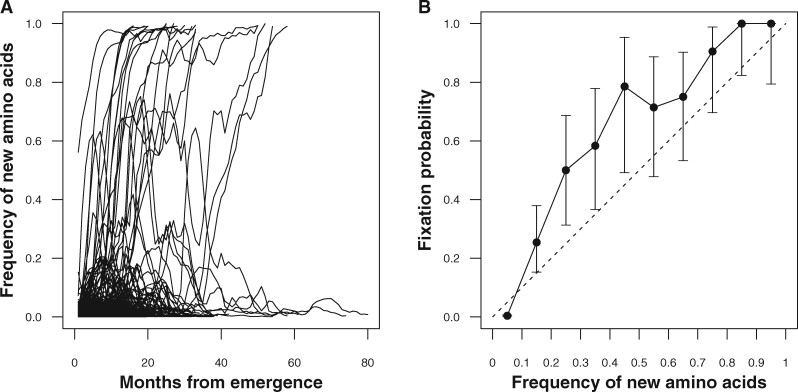
Figure 2.
The frequency of new amino acids on HA and their empirical fixation probability. (A) Trajectories of the frequency of new amino acids in the population from their emergence to fixation or extinction. Solid lines represent the frequency of new amino acids that later became fixed, while dotted lines represent those that later became extinct. (B) Empirical fixation probabilities of new amino acids stratified by their frequencies. X-axis represents the frequency of new amino acids at a position in the population. Y-axis represents the empirical fixation probability of new amino acid trajectories that reached the frequency on the X-axis. Error bars are the 95% binomial confidence intervals of the fixation probability.

