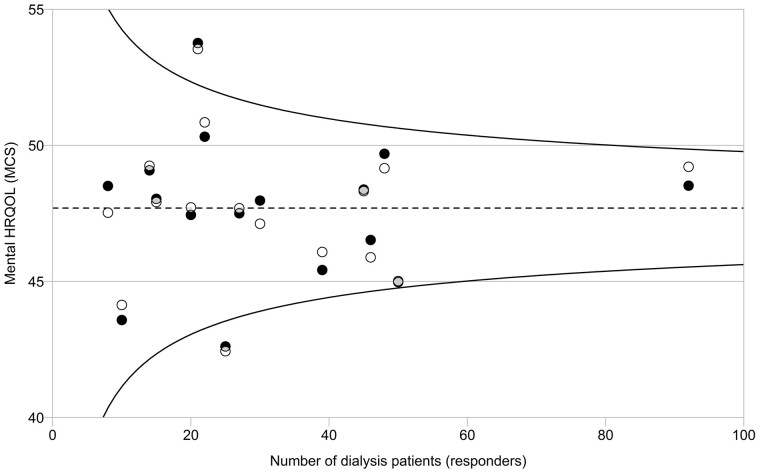
FIGURE 5.
Observed and adjusted mean mental HRQoL (MCS) in 16 pilot centres. Circles represent the mean observed (white circles) and adjusted (adjusted for sex, age, SES, primary kidney disease, dialysis modality and time on RRT; black circles) score for mental HRQoL per centre. Overlapping part of the circles is depicted in grey. The overall mean MCS (dotted line) is used as a reference in the comparison with each centre. The 95% confidence interval (CI; curved lines) is provided around the overall mean MCS. The mean scores of two centres are outside the 95% CI, one above and one below the funnel, indicating a statistically significant higher and lower MCS compared with the overall mean MCS, respectively.

