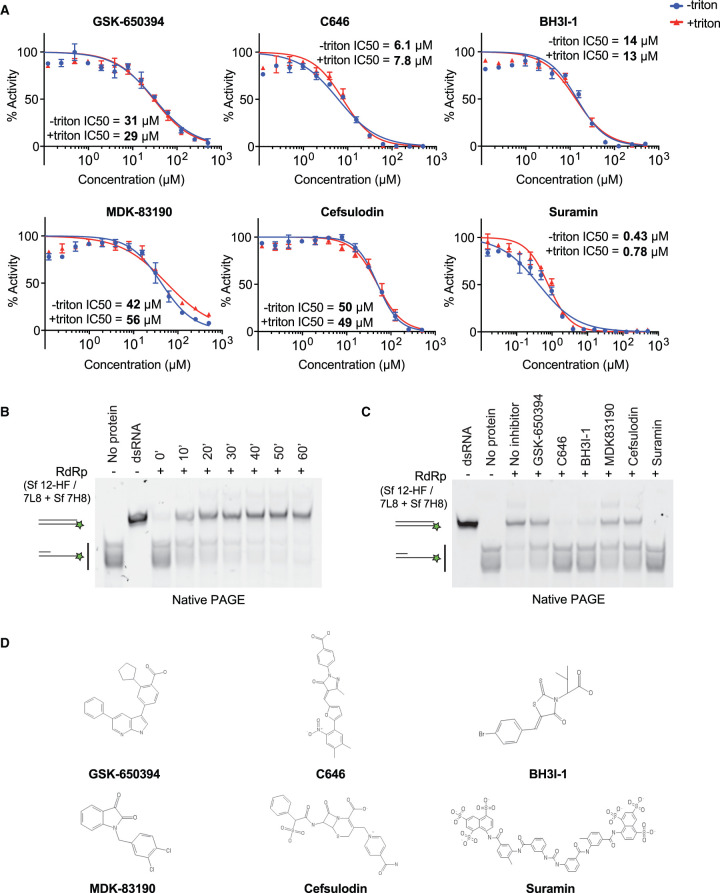
Figure 5. In vitro validation of selected compounds identified as RdRp inhibitors.
(A) Concentration–response curves of selected compounds using the strand displacement assay. The experiment was performed using 150 nM RdRp, 100 nM RNA substrate and 300 µM of each NTP in the presence (+Triton) or absence (−Triton) of 0.01% Triton X-100. Quenching controls are shown in Supplementary Figure S5B. IC50 values were calculated using Prism software. (B,C) Native gel-based assays using a primed RNA substrate as in Figure 1C. Reactions were started by mixing 300 nM RdRp complex (formed by preincubation of Sf nsp12-HF/7L8 and Sf 7H8 at 1 : 3 ratio) with 50 nM RNA substrate and 1 mM NTPs. Reaction products were analysed by native PAGE and visualisation of Cy3 fluorescence. (B) RdRp reactions were incubated for the indicated amounts of time. (C) Validation of selected compounds using 30-min RdRp reactions. RdRp complex was incubated with 50 µM of the indicated compounds for 10 min before reactions were started by substrate addition. Controls: a preformed dsRNA with the same size as the reaction product (dsRNA), the primed substrate (no protein). (D) Chemical structures of selected RdRp inhibitors.

