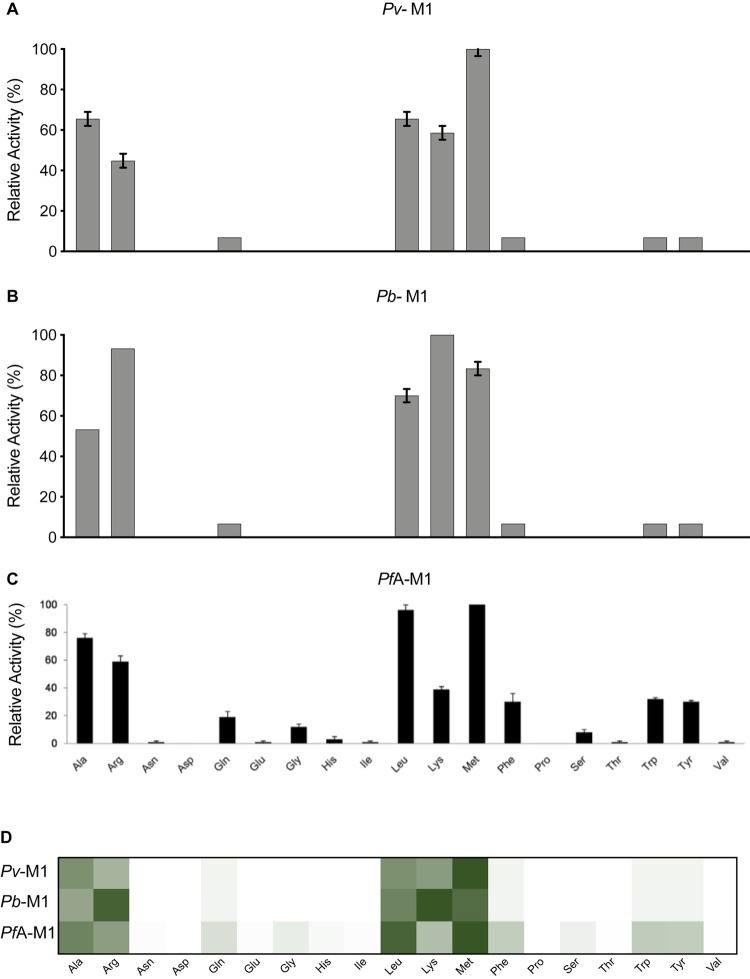
Figure 3. P1 natural amino acid substrate profile of M1 aminopeptidases from P. falciparum, P. vivax and P. berghei.
P1 substrate specificity screening of Pv-M1 (A), Pb-M1 (B) and PfA-M1 (C) [14] with a 19-membered natural amino acid library. The amino acid with highest activity recorded was assigned as 100% activity, and activity against other amino acids is represented as percentage activity. (D) Heat map depicting the most favored amino acids as dark green and least favored as white, with all intermediate values depicted as shades of green. Error bars represent ± standard deviation (SD). Experiments were carried out in biological triplicate.

