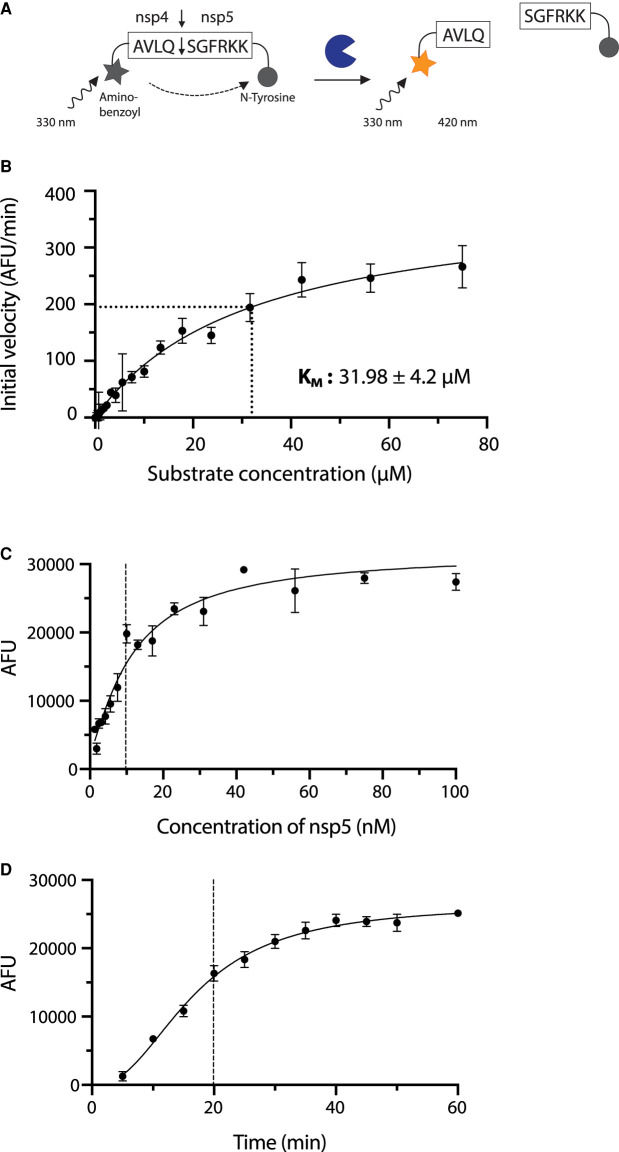
Figure 2. Enzyme assay design and characterisation.
(A) Schematic of the FRET-based protease assay. In the uncleaved state the fluorescence of aminobenzoyl is quenched by N-tyrosine. Once the protease cleaves the peptide, the fluorescent signal increases proportionally to protease activity. (B) Determination of enzyme kinetics. Initial reaction rates over a range of concentrations were plotted against substrate concentration to obtain values for KM (31.98 ± 4.1 µM). Values are stated as mean ± SEM, while data on the graph is plotted as mean and error bars represent standard deviation (SD), n = 3. (C) Protease activity of nsp5. Increase in fluorescence 20 min after the start of the reaction is shown over increasing nsp5 concentrations. Experiment was done in triplicate. (D) Time course of the nsp5 hydrolysis reaction. Increase in fluorescence at 10 µM enzyme concentration over time is shown. Experiment was done in triplicate.

