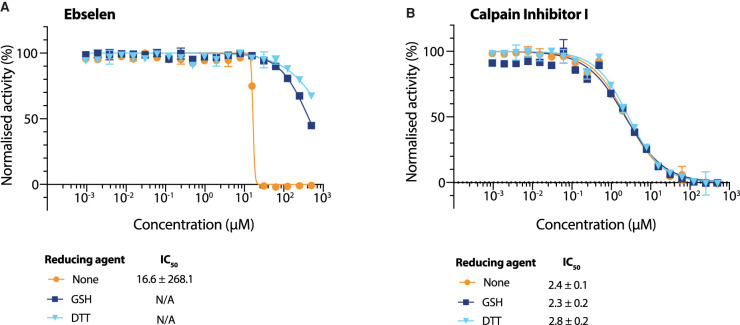
Figure 4. Evaluation of Ebselen as an nsp5 inhibitor.
(A and B) Dose response curves of Ebselen (A) and Calpain Inhibitor I (B) using different reducing agents in the buffer (DTT, GSH, no reducing agent). Data on the graph is plotted as mean and error bars represent SD, n = 3. IC50 values and Hill coefficients (nH) were determined by non-linear regression and given as mean ± SEM.

