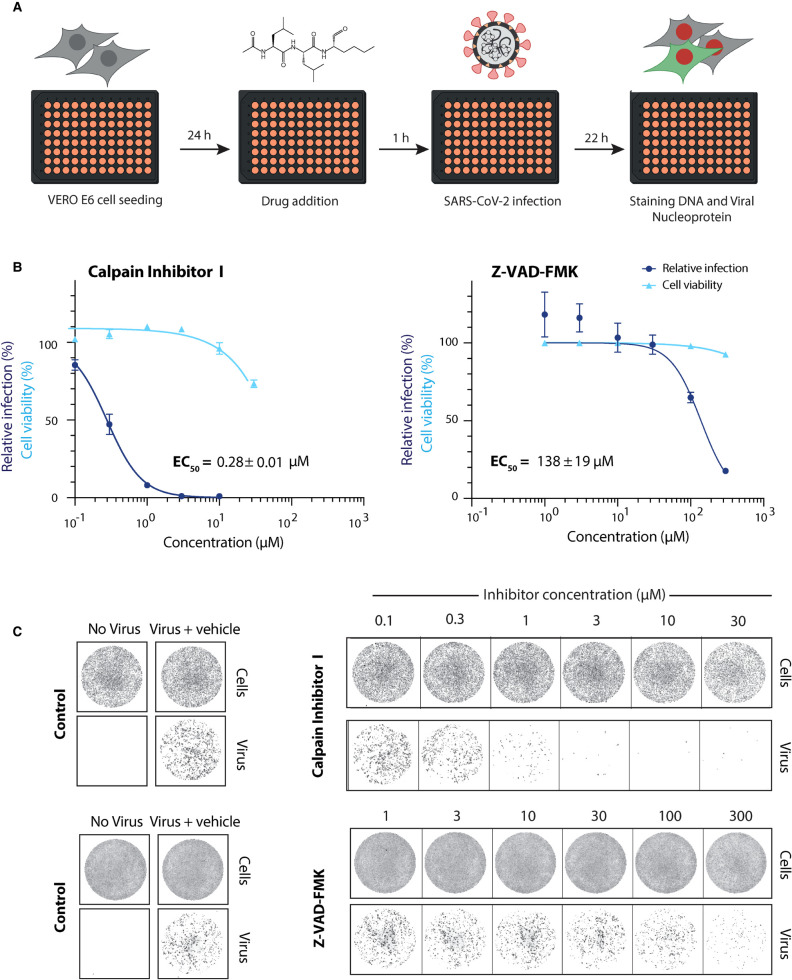
Figure 5. Antiviral activity of selected hits against SARS-CoV-2 in Vero E6 cells.
(A) Schematic overview of the viral infectivity assay in Vero E6 cells. Vero E6 cells were seeded in a 96-well format and treated with compounds at the indicated concentrations. This was followed by infection with SARS-CoV-2 isolate at a MOI of 0.5 PFU/cell. Afterwards, cells were fixed, stained for DNA with Draq7 and SARS-CoV-2 viral nucleocapsid protein (N protein) with an Alexa-488 labelled antibody and imaged (see Zeng et al. this issue). (B) Dose response curves for the validated hits (Calpain Inhibitor I and Z-VAD-FMK) in a viral infectivity assay in Vero E6 cells. Cell viability values represent the area of cells stained with DRAQ7 DNA dye. Viral infection values were measured as the area of viral plaques visualised by immunofluorescent staining of viral N protein. Data is normalised to DMSO only treated control wells (100%) and plotted as mean and SD of three replicates. Half-maximal effective concentration (EC50) values were determined by non-linear regression and given as mean ± SEM. (C) Representative images for the SARS-CoV-2 viral infectivity assay in Vero E6 cells, for Calpain Inhibitor I and Z-VAD-FMK. Representative wells show Vero E6 cells stained for DNA using DRAQ7 (top panel, labelled cells), and viral N protein immunofluorescence (lower panel, labelled virus).

