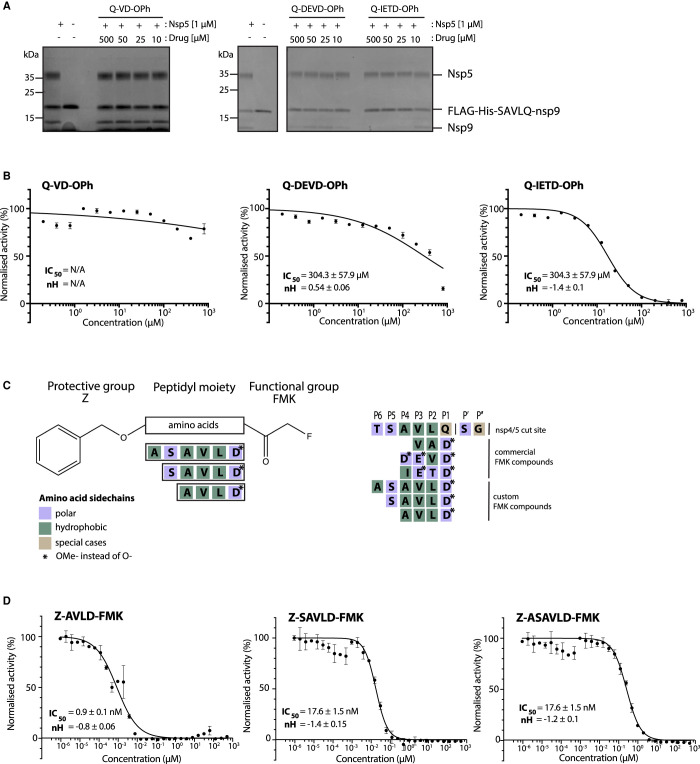
Figure 6. Development of improved nsp5 peptidomimetic inhibitors.
(A) Gel-based assay of nsp9 cleavage by nsp5 in the presence of the OPh peptidomimetic inhibitors at indicated concentrations. (B) Dose response curves of OPh inhibitors. In vitro inhibition of nsp5 was measured over a wide range of concentrations of the three OPh inhibitors using the FRET-based assay. Data is plotted as mean and standard deviation of three replicates. A dose response curve for its IC50 value was determined by non-linear regression and IC50 values are given as mean ± SEM. (C) Schematic of the FMK peptide inhibitors. Amino acids with different functional side chains are colour coded. (D) In vitro activity of nsp5 was measured over a wide range of concentrations for the three custom FMK peptides using the FRET-based assay. Data is plotted as mean and standard deviation of three replicates. Dose response curves for IC50 values and Hill coefficients (nH) were determined by non-linear regression and values are given as mean ± SEM.

