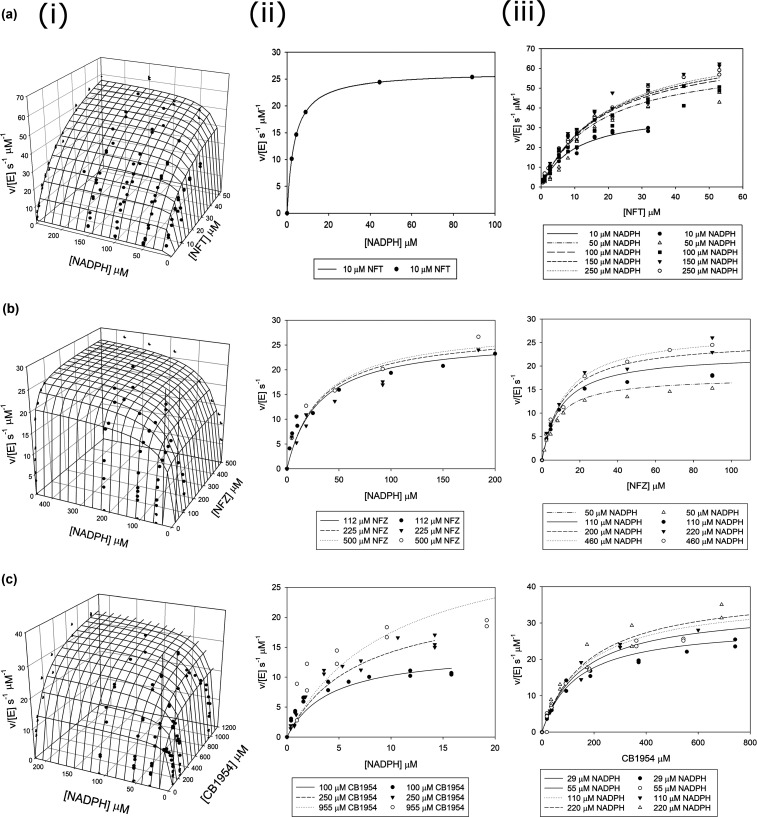
Figure 2. Steady-state kinetics of NfsA with nitroaromatic substrates.
Steady-state kinetics of the reduction of (a) Nitrofurantoin, (b) Nitrofurazone, and (c) CB1945 by NADPH, catalysed by NfsA. Initial rates of reaction at different concentrations of NADPH and substrate were monitored. (i) The global, 3D fits of all the data; dots show the experimental rates and the mesh shows the fit to equation (1). (ii) Reactions done at different initial concentrations of NADPH at a series of constant substrate concentrations, the dots show the experimental points and the lines show the fits of the global rate constants. (iii) as (ii) but reactions were done at various concentrations of nitroaromatic substrate at different constant concentrations of NADPH. The reactions were measured in a 10 mM Tris pH 7.0 buffer and 4.5% DMSO, at 25°C; those with nitrofurantoin also contained 50 mM NaCl. (a) For nitrofurantoin, the lines are the simulations of equation (1) for kcat 81 s−1, Km nitrofurantoin 20.6 µM, and Km NADPH 10.9 µM. (b) For nitrofurazone, the lines are the simulations for kcat 29.6 s−1, Km nitrofurazone 13.0 µM, and Km NADPH 34.0 µM. (c) For CB1945 the lines are the simulations for kcat 42.0 s−1, Km CB1954 190 µM, and Km NADPH 12.0 µM. The standard deviations and P statistics for the fits are given in Table 1.

