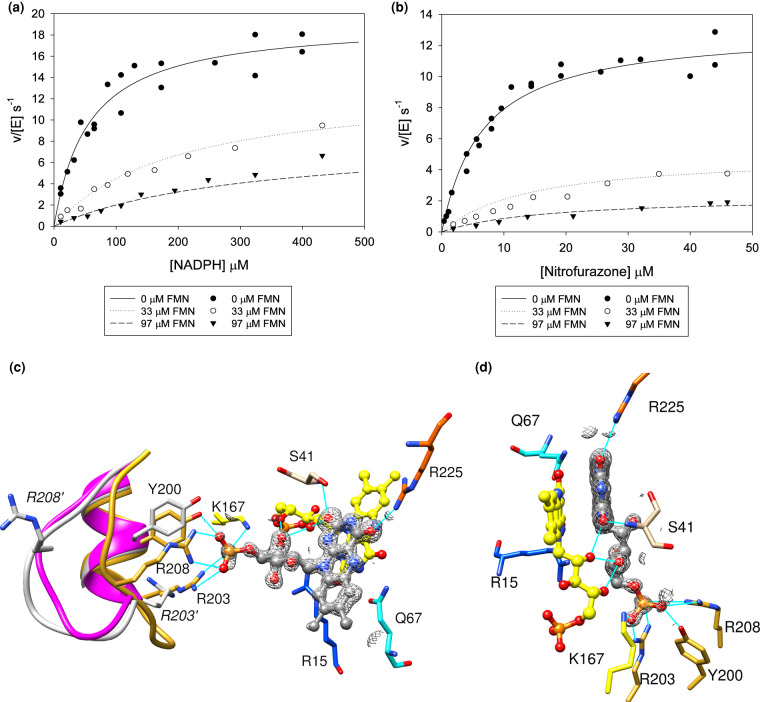
Figure 8. Kinetics and structure of NfsA with FM.
(a,b) Steady-state kinetics of NfsA with nitrofurazone in the presence or absence of FMN. (a), reactions done with 99 µM nitrofurazone, varying NADPH. (b), reactions done with 97 µM NADPH, varying nitrofurazone. All reactions were done in a 10 mM Tris pH 7.0 buffer containing 50 mM NaCl and 4.5% DMSO, at 25°C. The symbols show the measured rates and the lines show the simulated Michaelis Menten curves for mixed inhibition, with Km NADPH 62 µM, Km nitrofurazone 11 µM, kcat 21.4 s−1, Ki NADPH 8 µM, and Ki nitrofurazone 7 µM. The standard errors in the fitting parameters and the P statistics for the data are given in Supplementary Table S3. (c) The structure of a second FMN bound to NfsA. The FMN ligand is shown in ball and stick representation with the carbon atoms in grey and the heteroatoms coloured as in Figure 3a. The FMN cofactor is coloured as in Figure 3a. The backbone of residues 198–210 and carbon atoms of selected side chains of that region are coloured in gold for the FMN-bound structure, grey for the nitrofurantoin-bound structure and purple for the structure in the absence of ligand from 1F5V [27]. Side chains of residues R203 and R208 from the nitrofurantoin-bound structure are labelled in italics and given a prime symbol. All other side chains, in normal font, are from the FNM-bound structure and are coloured as in Figure 3a, with the heteroatoms of the side chains coloured blue for nitrogen and red for oxygen. The mesh shows the electron density within 2 Å of the FMN ligand at 0.7 sigma, (0.092 e). Cyan lines show the hydrogen bonds between the protein, the FMN cofactor, and the FMN ligand. (d) A second view of the structure shown in (c), with the same colouring.

