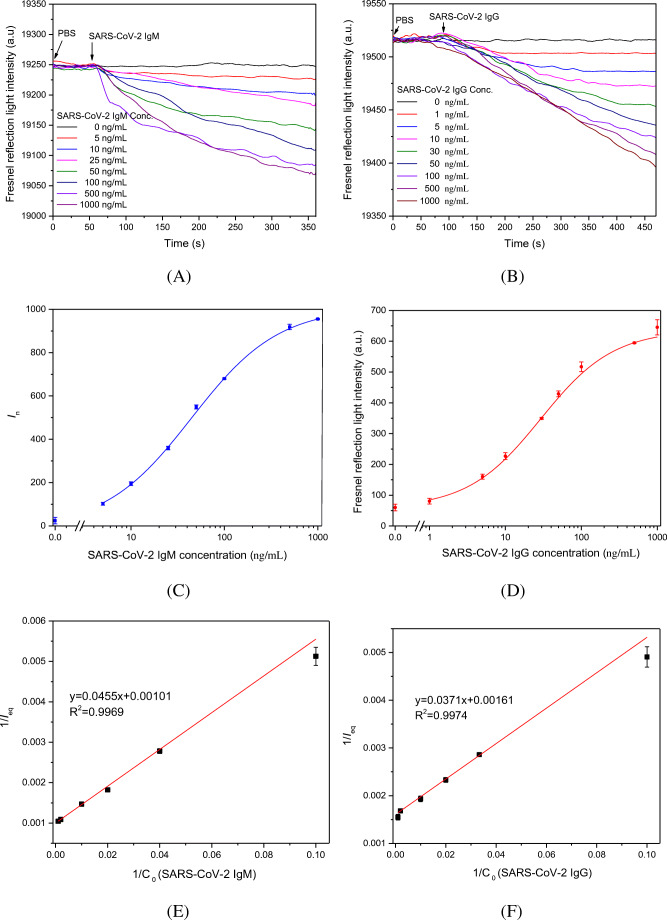
Fig. 4.
Detection of SARS-CoV-2 IgG or SARS-CoV-2 IgM in PBS. A Representative signal curves of SARS-CoV-2 IgM in PBS. B Representative signal curves of SARS-CoV-2 IgG in PBS. C Dose-response curve of SARS-CoV-2 IgM in PBS (IgM concentrations ranged from 0 to 1000 ng/mL, reaction time was 300 s). D Dose-response curve of SARS-CoV-2 IgG in PBS (IgG concentrations ranged from 0 to 1000 ng/mL, reaction time was 400 s). E Dependence of 1/Ieq against 1/[C]0 for the association between SARS-CoV-2 IgM and goat anti-SARS-CoV-2 IgM antibody. F Dependence of 1/Ieq against 1/[C]0 for the association between SARS-CoV-2 IgG and goat anti-SARS-CoV-2 IgG antibody. Error bars corresponded to SD of the data points in triple experiments

