
Figure 4:
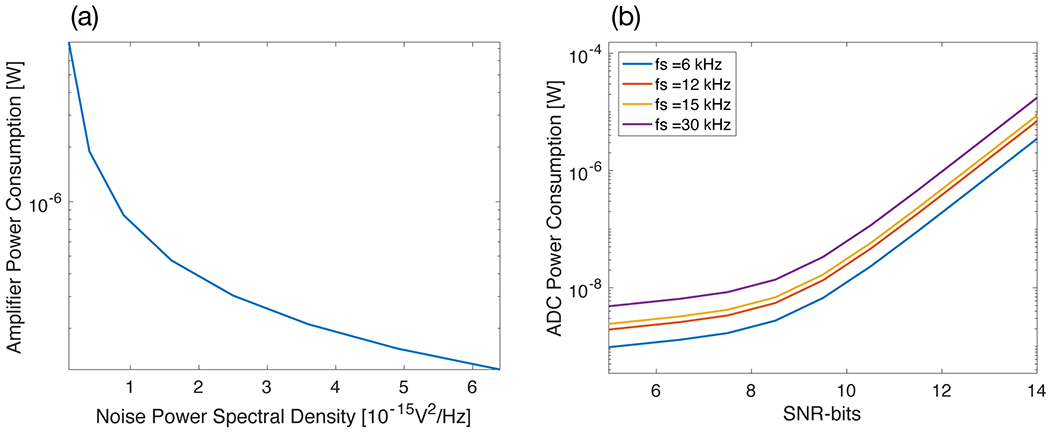
Power consumption trends in neural amplifiers and analog-to-digital converters. (a) Power consumption as a function of input-referred noise power spectral density (PSD) for a neural amplifier - equation (1) and PEF = 1.12 V used for this plot [30]. (b) Power consumption as a function of SNR-bits for an analog-to-digital converter for different sampling frequency (fs)- see Methods for the model used for this plot.