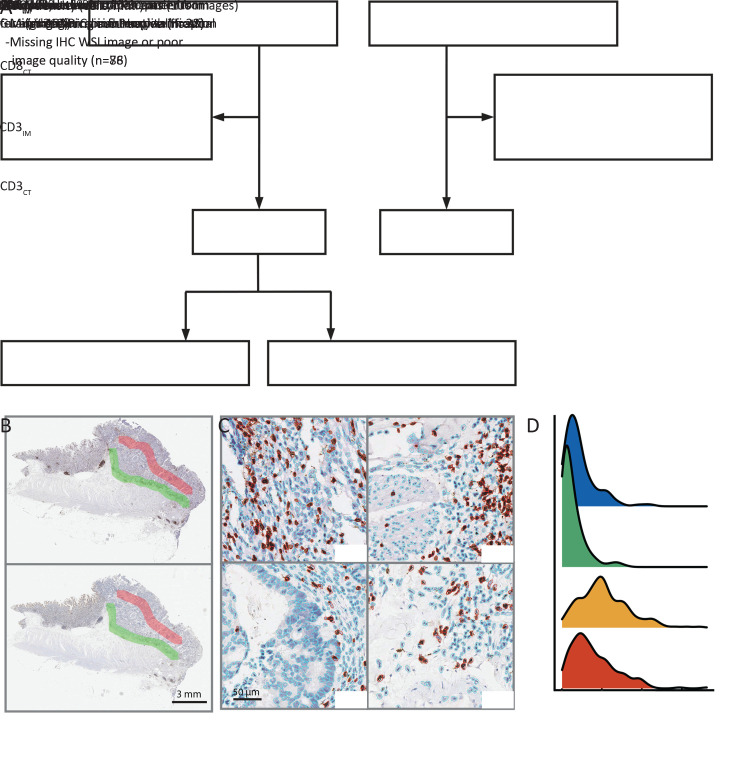
Figure 1.
Study profile and modified Immunoscore calculation. (A) Study profile; (B) CD3 and CD8 WSIs with annotation. Red region for CT and green region for IM; (C) Examples of cell segmentation results. Immune cells were marked in red, and other types were marked in blue; (D) Mean density distributions of four cells counting results. CT, core of the tumor; IM, invasive margin; WSI, whole-slide image.

