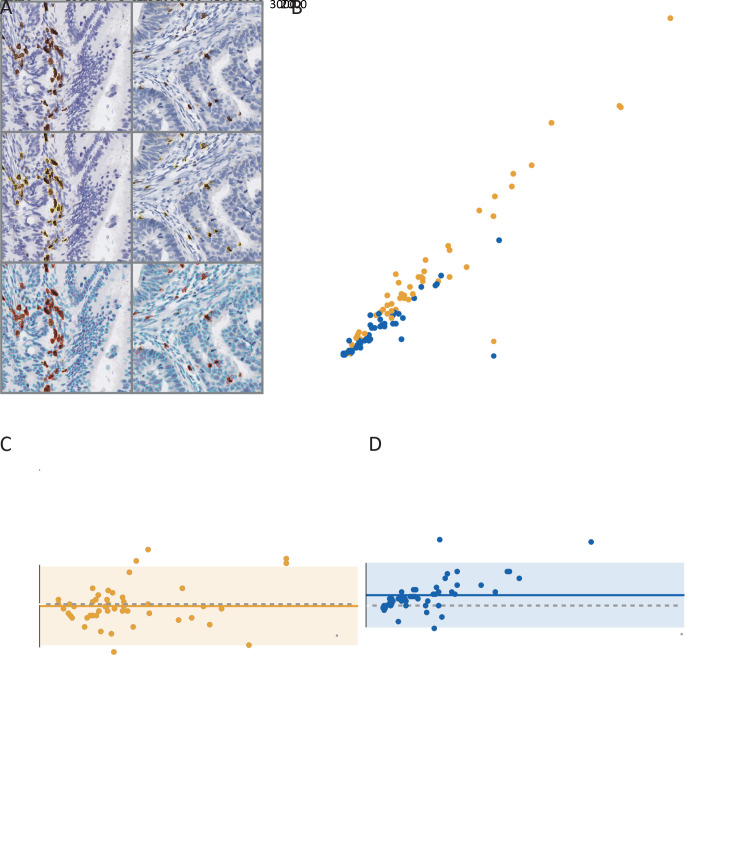
Figure 2.
Immune cell counting consistency analyses. (A) Examples of IHC (CD3 and CD8) image block (1,024×1,024 pixel2 at 40× magnification), pathologist annotation, and segmentation result; (B) Concordance of immune cells counting between automatic segmentation and pathologist annotation (CD3: ICC=0.985, 95% CI, 0.973−0.991; CD8: ICC=0.932, 95% CI, 0.884−0.961); (C) Bland-Altman plot for CD3+ cells counting estimation; (D) Bland-Altman plot for CD8+ cell counting estimation. The solid horizontal line is mean, the dashed line is zero, and the shaded regions are 95% CIs; IHC, immunohistochemical; ICC, interclass correlation coefficient; 95% CI, 95% confidence interval.

