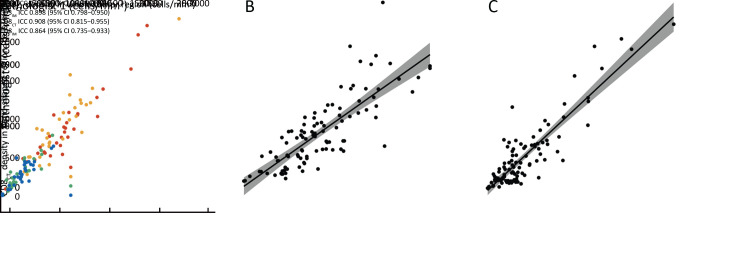
Figure 3.
Consistency and correlation analyses. (A) CT and IM annotation consistency analysis (CD3CT: ICC=0.951, 95% CI, 0.899−0.976; CD3IM: ICC=0.898, 95% CI, 0.798−0.950; CD8CT: ICC=0.908, 95% CI, 0.815−0.955; CD8IM: ICC=0.864, 95% CI, 0.735−0.933); (B,C) Correlation analyses for immune cells CD3 (r=0.81, P<0.001) (B) and CD8 (r=0.89, P<0.001) (C) density in the whole tumor region and the band-shaped region. CT, core of the tumor; IM, invasive margin; ICC, interclass correlation coefficient; 95% CI, 95% confidence interval.

