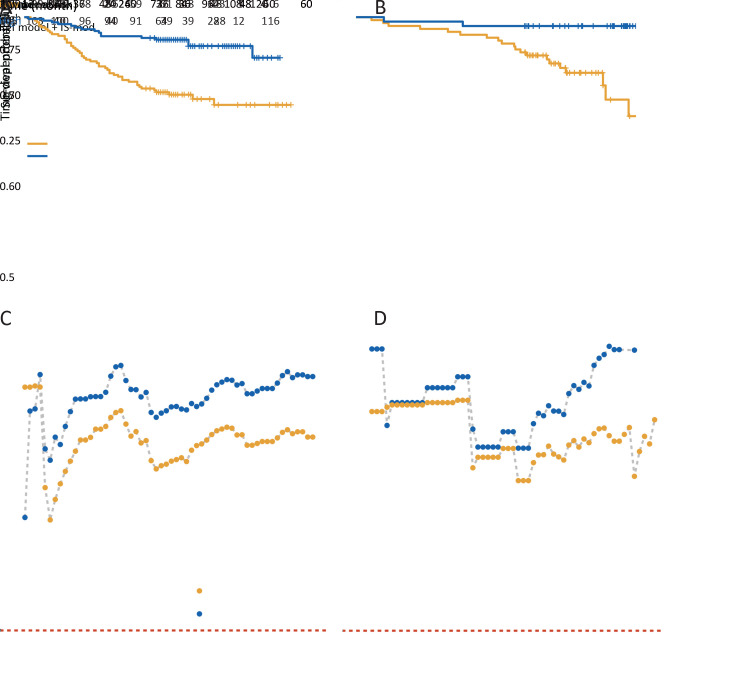
Figure 5.
Kaplan-Meier curves analysis and performance of models. (A,B) Kaplan-Meier survival curves of overall survival of high vs. low IS-mod [(A) HR=0.28, 95% CI, 0.16−0.49; P<0.001; C-index=0.653, 95% CI, 0.597−0.710; (B) HR=0.11, 95% CI, 0.02−0.46; P=0.003; C-index=0.666, 95% CI, 0.580−0.752]; (C,D) Time-dependent AUC was measured from one month to five years at 1-month intervals, reflecting the performance of predicting overall survival at different timepoints. A reference model was developed with only TNM stage and age, and a full model (reference model + IS-mod) is shown compared with the reference model. Left panel: discovery cohort; Right panel: validation cohort. AUC, area under the receiver operating characteristic curve; TNM, tumor-node-metastasis; IS-mod, modified Immunoscore.

