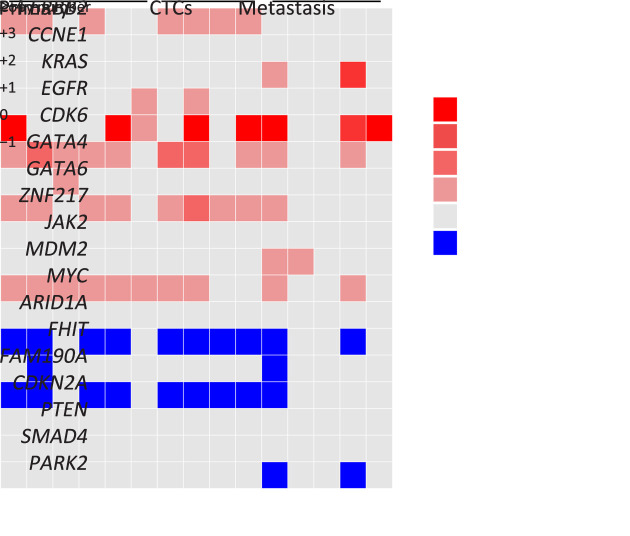
Figure S2.
Methylation heatmap of individual CTCs and tumor nuclei from paired primary and metastatic tumor tissue derived from Patient GC1. A total of 20 known gastric cancer-associated gene promoters were used for the analysis. The color key from blue to yellow indicates low to high methylation level; the white checks indicate unavailable data. CTC, circulating tumor cell.

