Figure 3.
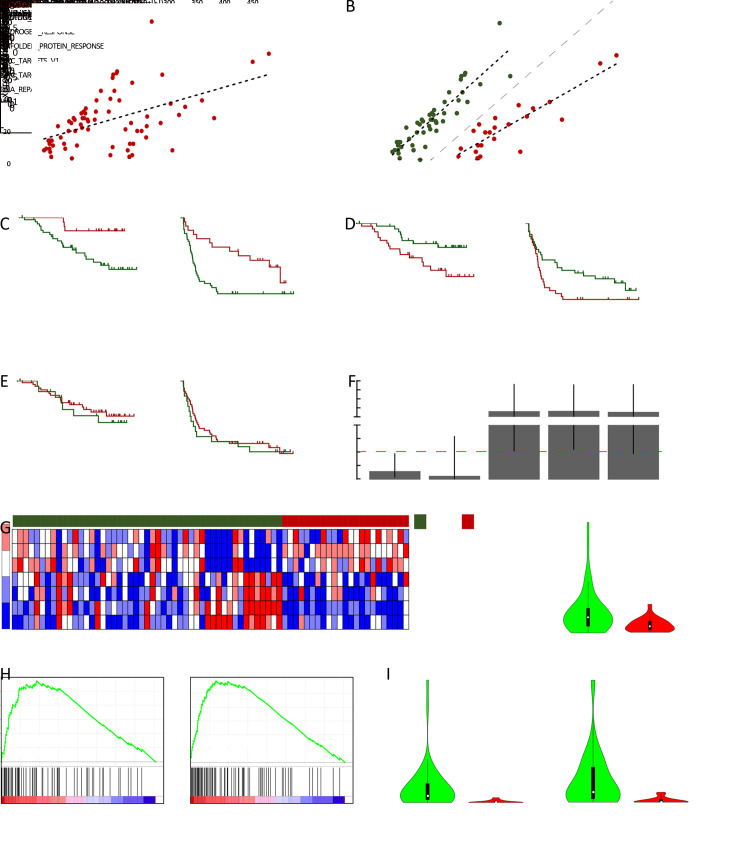
Two subgroups of HCC patients with distinct neoantigen expression patterns. (A) Scatterplot showing correlation between neoantigen load and expressed neoantigen load (R2=0.506, P<0.001); (B) Scatterplot showing two subgroups (marked by green and red, respectively) with distinct neoantigen expression patterns (Cluster1: R2=0.901, P<0.001; Cluster2: R2=0.885, P<0.001); (C−E) Kaplan-Meier curves of OS and RFS for patients from different subgroups (C) or stratified by proportion of expressed neoantigens (D) and load of expressed neoantigens (E); (F) ORs and 95% confidence intervals of the clinical parameters between patients from different subgroups. ORs and P values were calculated by χ2 test (*) and Fisher’s exact test (#); (G) Heatmap showing the top hallmark gene sets differentially enriched in the two subgroups (left), and violin plot comparing MYC expression level (TPM) between the two subgroups (right); (H) GSEA plot illustrating two MYC target gene sets significantly enriched in NEP-H subgroup compared with NEP-L subgroup; (I) Differences of microsatellite instability sites and MSI scores between the two subgroups. HCC, hepatocellular carcinoma; OS, overall survival; RFS, recurrence-free survival; OR, odds ratio; BCLC, Barcelona Clinic Liver Cancer; NEP-H, neoantigen expression probability high; NEP-L, neoantigen expression probability low; NES, normalized enrichment score; MSI, microsatellite instability.

