Figure 5.
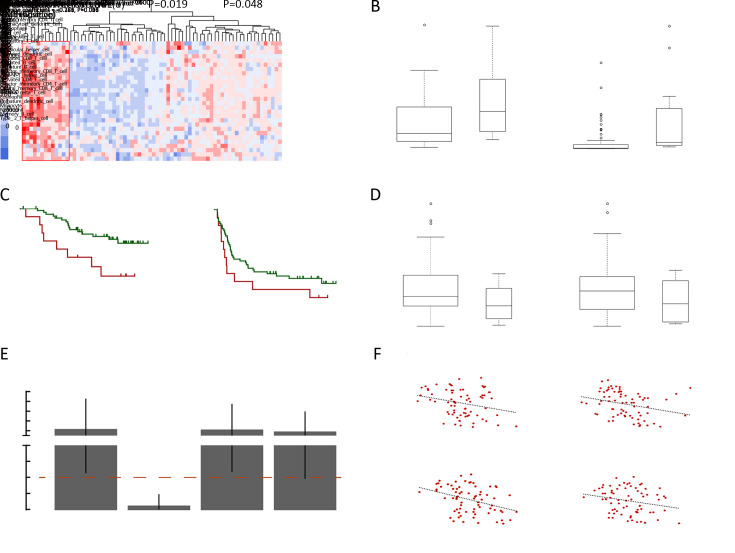
Neoantigens and immune cell infiltration. (A) Heatmap showing HCC sample clustering based on estimated infiltration of 28 immune cell types; (B) Differences of T cell clonality and T cell richness between immunologically cold and immunologically hot tumors; (C) Kaplan-Meier curves of OS (left) and RFS (right) comparing patients with immunologically cold or immunologically hot tumors; (D) Differences of somatic mutation load (left) and somatic neoantigen load (right) between immunologically hot and immunologically cold tumors; (E) ORs and 95% confidence intervals comparing the clinical parameters between immunologically hot tumors and immunologically cold tumors; (F) Scatterplots showing correlation between proportion of expressed neoantigens and the level of estimated infiltration of different immune cells, only immune cell types with significant correlation were shown. HCC, hepatocellular carcinoma; OS, overall survival; RFS, recurrence-free survival; OR, odds ratio; BCLC, Barcelona Clinic Liver Cancer.

