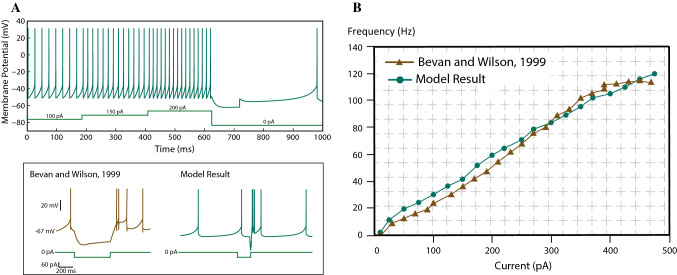
Fig. 4.
Results for the simulation of the single-cell dynamical model of the STN. A Modelled cell responses to depolarising and hyperpolarising inputs. Up: the model responds to a depolarising input with an increased frequency; there is also an spontaneous activity without any stimulation. Bottom: a hyperpolarisation causes a rebound of burst spikes followed by a spontaneous low-frequency firing state. The green lines at the bottom of the figures show the strength of the injected current. B The frequency response of the model fits well with the results of the experiments given in Bevan and Wilson (1999). The slope of the f-I curve slightly increases around 30 Hz. (Color figure online)

