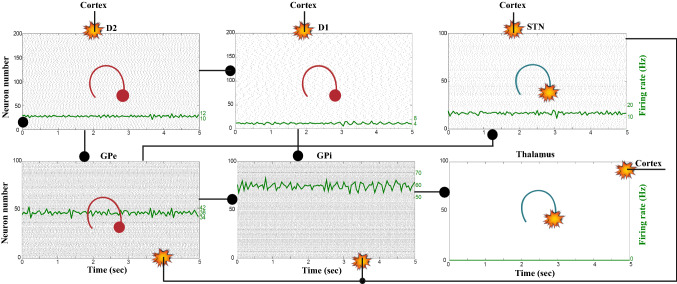
Fig. 8.
Default network mode. Raster plots of the spiking activity of the relevant simulated neural populations when no external stimulus is injected to the cortical network and the level of dopamine is defined by for all t. The associated dopamine level, the external stimulus applied to the cortex and the NMDA-cortical neurons’ response applied to the -MSNs, the -MSNs, the STN and the thalamus are given in Fig. 7. Each black dot corresponds to a spike of the corresponding neuron at a given time. For each population, the green functions on the raster plots show the average firing rate for the 20 simulations produced. The raster plots are for one of these simulations. The sparks indicate excitatory connections, whereas the circles are inhibitory connections

