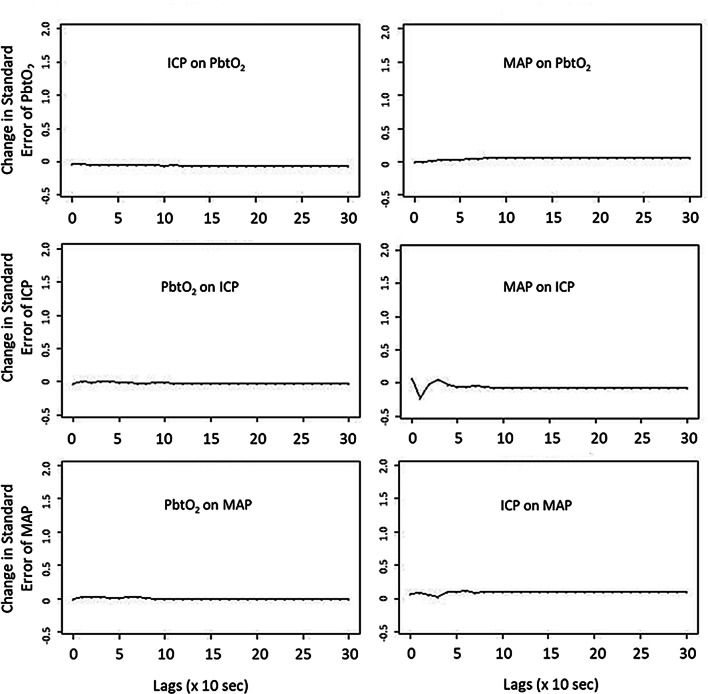
Fig. 2.
Tri-Variate VARIMA Model IRF Plot—ICP, MAP and PbtO2—Patient Example. ICP intracranial pressure, IRF impulse response function, lags refers to number of time points where 1 lag is 10-s, MAP mean arterial pressure, PbtO2 brain tissue oxygen, VARIMA vector autoregressive integrative moving average. The tri-variate VARIMA model was constructed using an autoregressive order of 4, integrative order of 1, and moving average order of 4. The IRF plots display the response of one physiologic variable to one standard deviation impulse of the other. Of note, there is minimal response of PbtO2 to an impulse in MAP or ICP

