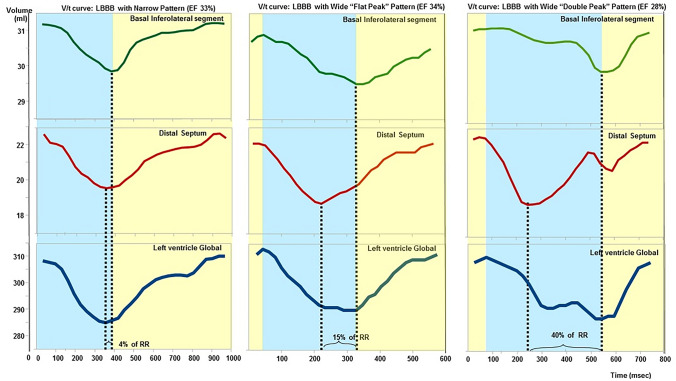
Fig. 1.
Examples of narrow pattern and wide pattern. The volume/time (V/t) curves of 3 patients with non-ischaemic systolic heart failure are reported. The regional V/t curve of basal inferolateral region and distal septum are shown in the upper and middle panel, respectively. The panel below provides the global left ventricular V/t curves. The maximal dyssynchrony time was 4% of the R-R interval in the patient with the narrow pattern (left), 15% in the patient with the wide, “flat-peak” pattern (centre), and 40% in the patient with the wide, “double-peak” pattern (right)

