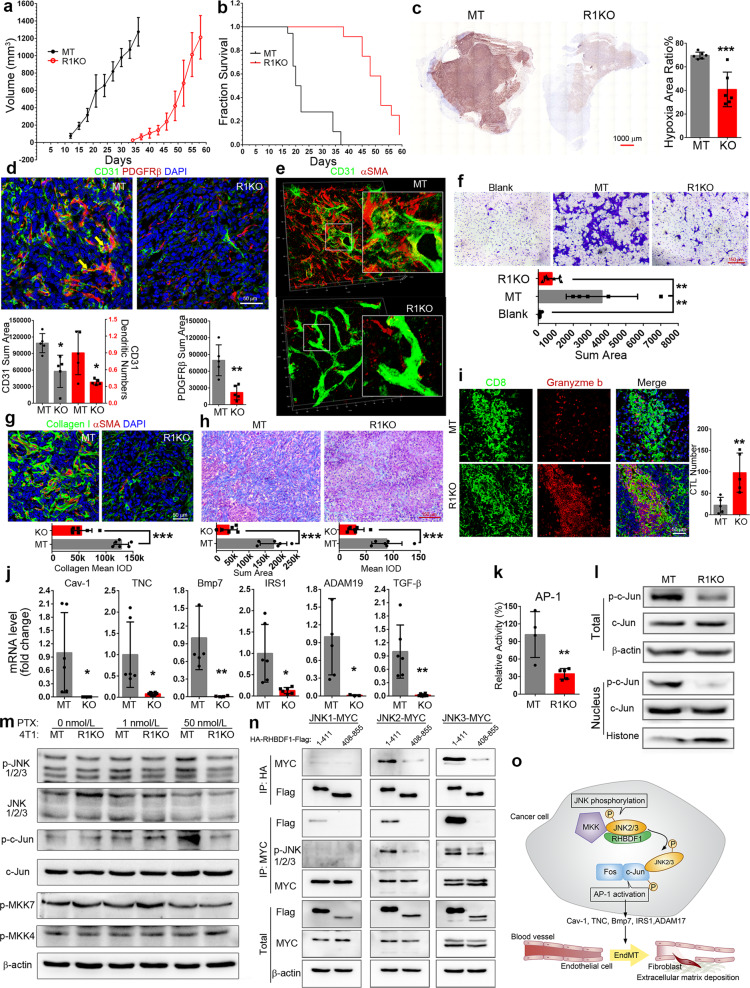
Fig. 1.
a, b Plots of tumor growth rates and survival time of mice inoculated with either RHBDF1 knockout (R1KO) or mock-transfected 4T1 cells (MT). c Typical images of the overall extent of hypoxia in tumors detected by hypoxyprobe (left); the ratio of hypoxic area versus non-hypoxic area was determined by computer-assisted image analysis (right). d Typical images of immunofluorescence co-staining of 4T1 tumor specimens for fibroblast cell marker PDGFRβ and endothelial cell marker CD31; area of CD31 and PDGFRβ, and the dendritic number of vessels were determined by Image-Pro Plus, n = 5. e Typical images of 3D confocal microscopic analysis of MT and R1KO 4T1 tumor specimens demonstrating blood vessel structure and EndMT in progress; insets: details of the selected area (3× magnifications). f Crystal violet staining of the bottoms of the transwell chambers containing wildtype 4T1 cells co-cultured with HUVECs that were pre- co-cultured with either R1KO or MT 4T1 cells. g Co-fluorescent staining of collagen I (green) and aSMA for CAFs (red); the content of collagen is showed below, n = 5. h Masson staining of the tumor; blue area indicates tumor stroma, and the content is shown below, n = 6. i Fluorescent co-staining of CD8 and granzyme b of either R1KO or MT 4T1 tumors; the number of cytotoxic T cells (double-positive) was determined by image analysis, n = 6. j Quantitative analysis of the transcription level of the indicated genes by qPCR, n = 6. k AP-1 transcription activation assay by a luciferase-based reporter system. l Western blotting analysis of c-Jun phosphorylation in whole cell or nucleus of MT or R1KO 4T1 cells. m Western blotting analysis of JNK1/2/3 and c-Jun phosphorylation after PTX treatment (48 h). n Co-immunoprecipitation analysis in MCF-7 cells of co-transfected JNK1, 2 or 3 and various RHBDF1 fragments (amino acid residues 1–411 and 406–855). o Schematic representation of RHBDF1-supported activation of transcription factor AP-1 and the impact on tumor stroma modulation. Data are means ± SD. Statistics, Student’s t test, *P < 0.05, **P < 0.01, ***P < 0.001

