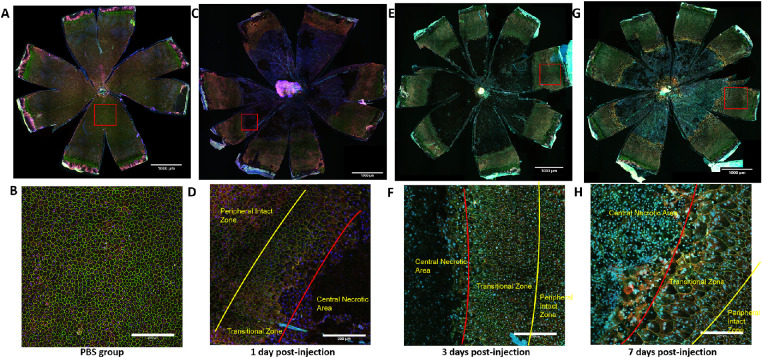
Figure 11.
RPE layers in response to systemic exposure to NaIO3 in 129/SV-E mice. The RPE flatmounts from 129/SV-E mice were immunostained for ZO-1 (green), α-catenin (red), and Hoechst (blue). (A) RPE flatmounts from the PBS group. (B) High-resolution image from the PBS group. (C, E, G) Representative RPE flatmounts from NaIO3-treated 129/SV-E mouse groups. (D, F, H) High-resolution images of the transition zone in RPE flatmounts from NaIO3-treated groups. RPE cells near the center were highly irregular in shape and size. Scale bar in A, C, E, and G: 1000 microns; scale bar in B, D, F, and H: 200 microns.

