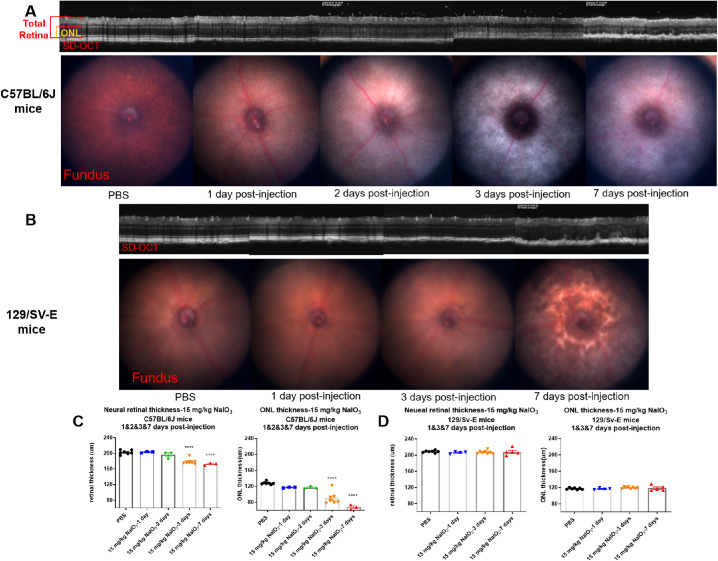
Figure 6.
SD-OCT and fundus images of C57BL/6J and 129/SV-E mice after injection with 15 mg/kg of NaIO3. (A, B) Representative SD-OCT and Micron IV fundus photography for each day after 15 mg/kg of NaIO3 treatment of C57BL/6J mice and 129/SV-E mice; red and orange brackets show the regions used for neural retina and ONL thickness measurement. (C, D) Quantification of SD-OCT images. The results are presented as mean ± standard error of the mean (SEM). A one-way analysis of variance (ANOVA) with Tukey's multiple comparisons test was conducted between the mean thickness measurements in all possible pair combinations. ****P < 0.0001. n = 3–8 in the C57BL/6J mouse groups, n = 4–7 in the 129/SV-E mouse groups.

