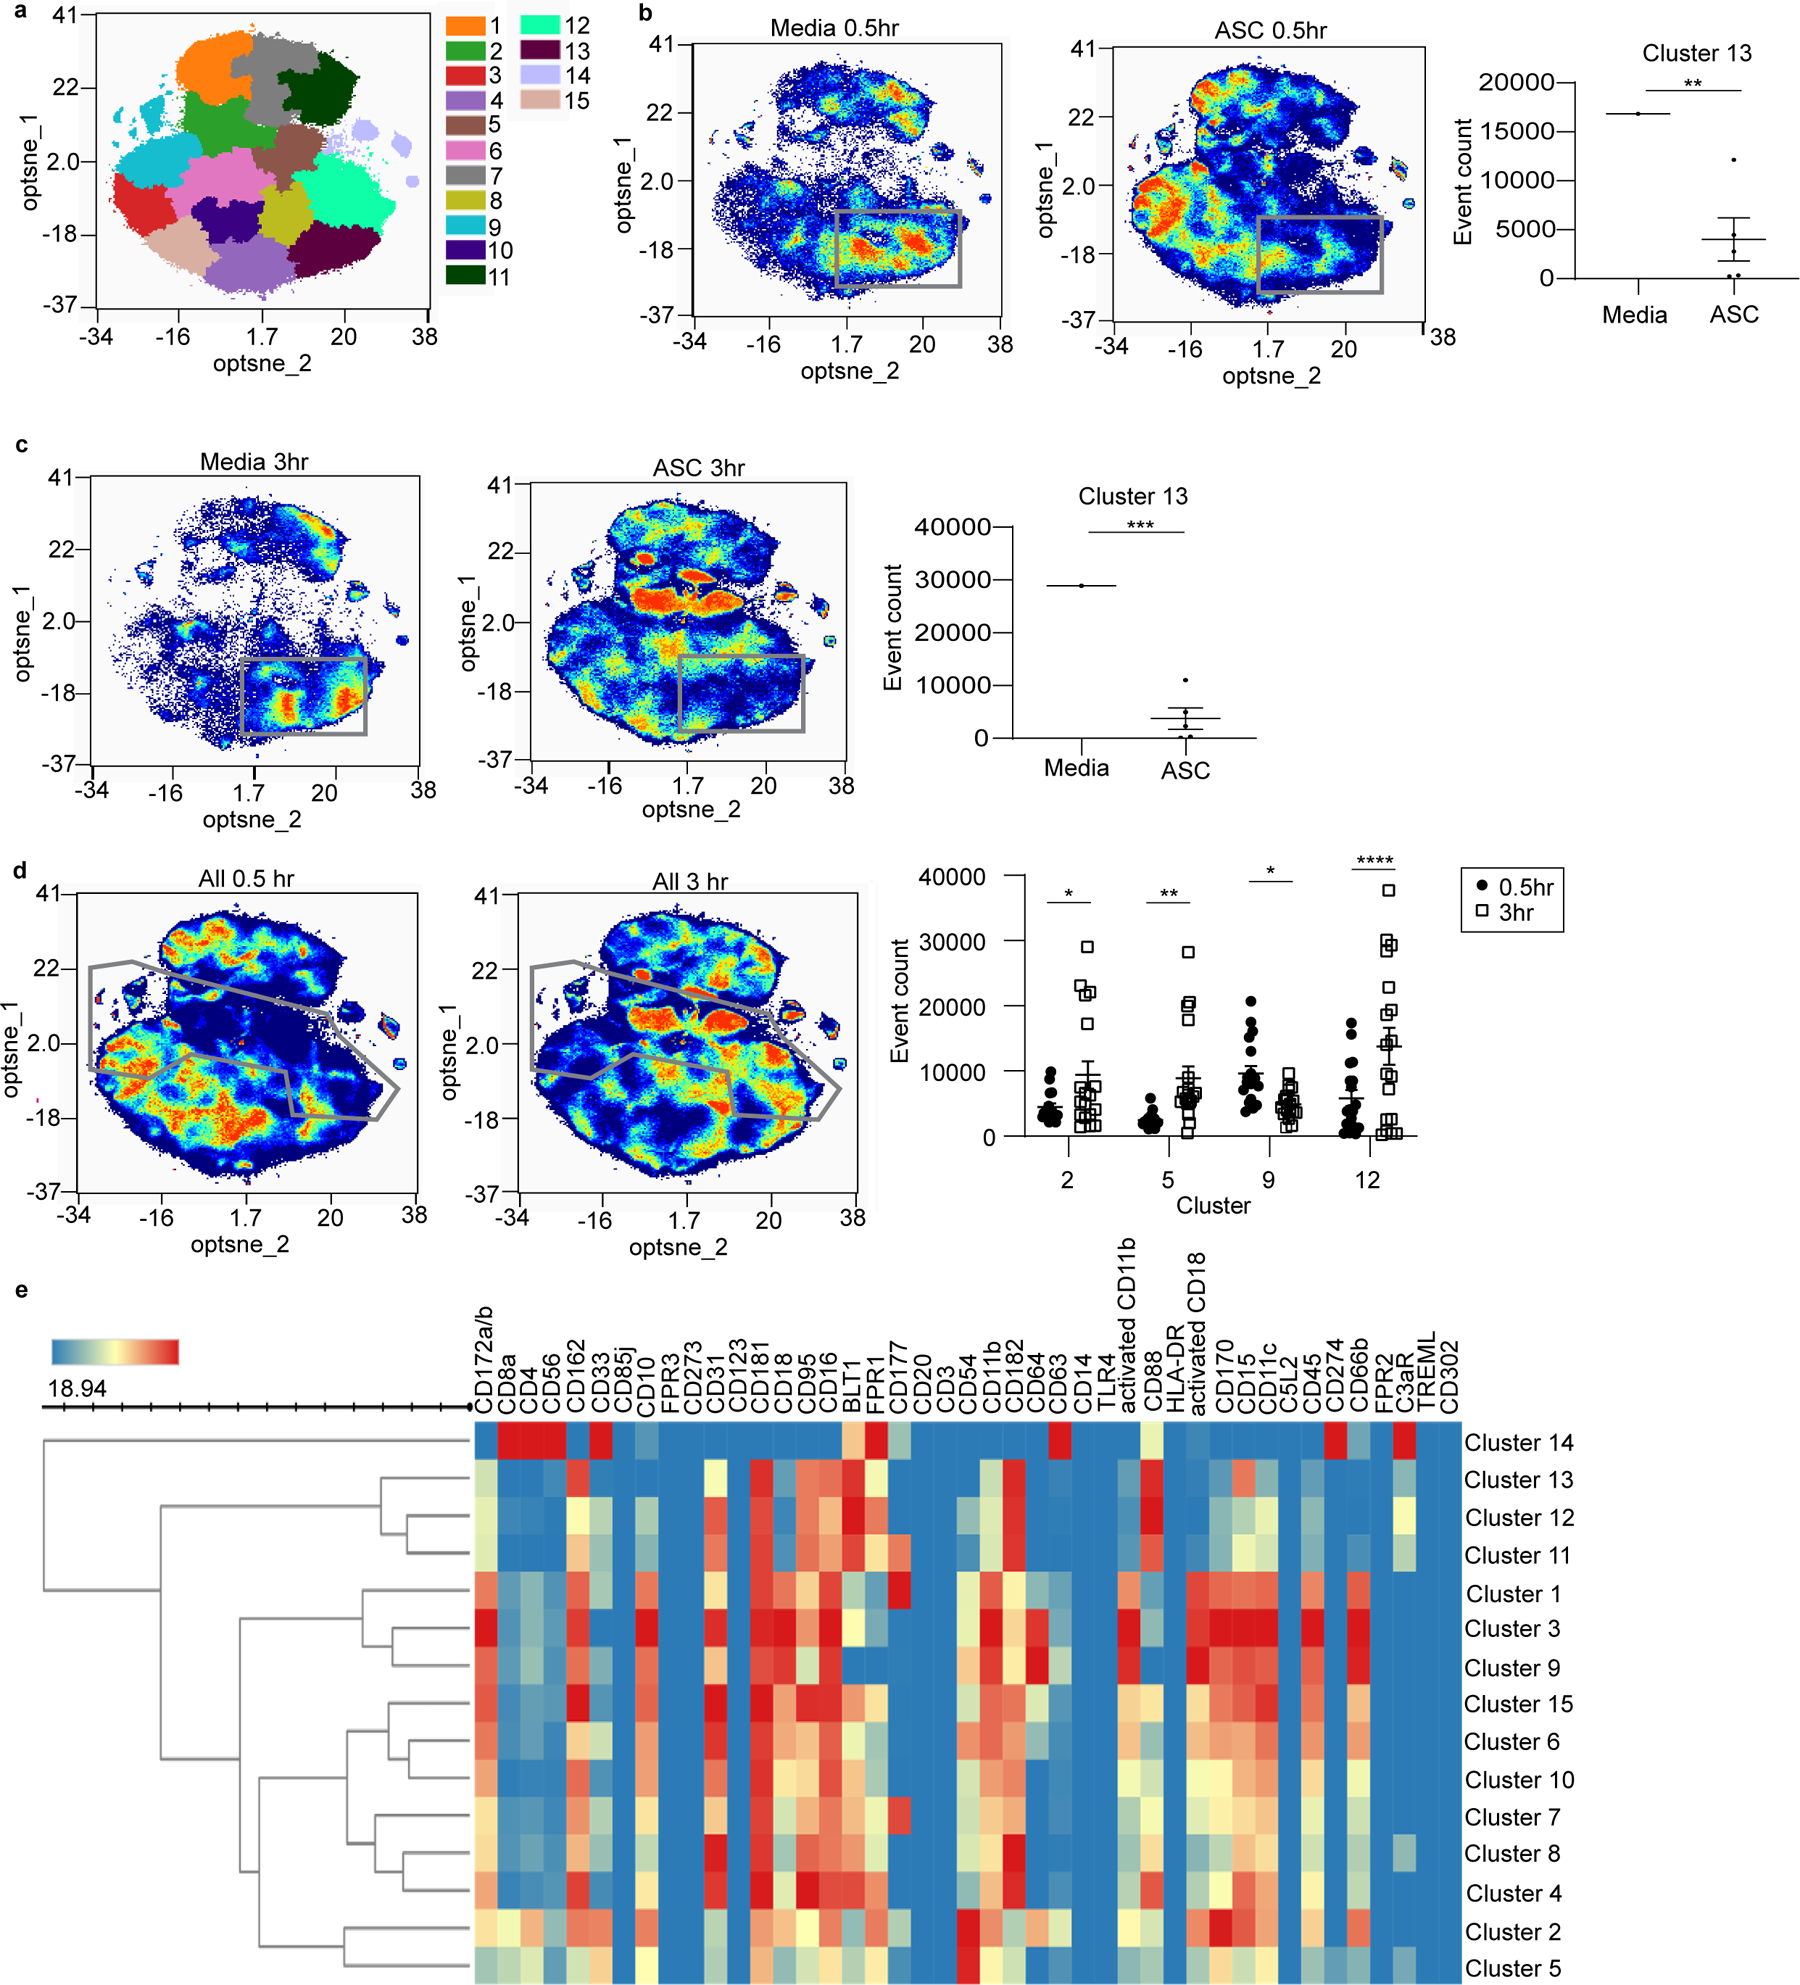
Figure 4: ASC exposure induces distinct neutrophil subpopulations based on CyTOF profiling.

(a) Normal donor neutrophils incubated in ASC or media for 0.5 or 3hrs were surface labeled using heavy metal-conjugated antibodies against 43 surface proteins and analyzed by CyTOF. Clustering of the data using opt-SNE analysis identified 15 distinct neutrophil clusters denoted by the indicated colors. (b,c) Comparison of media vs ASC at 0.5 and 3hr showed a significant decrease in the percentage of neutrophils occupying cluster 13 (outlined by grey boxes). (d) Comparison of ASC samples at 0.5 and 3hr showed significant increases in neutrophil populations within clusters 2, 5, and 12 and a decrease in cluster 9 at 3hr (borders of these clusters are outlined in grey). (e) Heat map indicating marker expression levels that define each individual cluster. Opt-SNE plots, opt-SNE density plots, PARC clustering, SPADE maps, and heat maps were created and analyzed using OMIQ (Santa Clara, CA). Cluster abundance statistics were exported from OMIQ and analyzed using multiple t-tests (*p<0.05, **p<0.01, ***p<0.001, ****p<0.0001).
