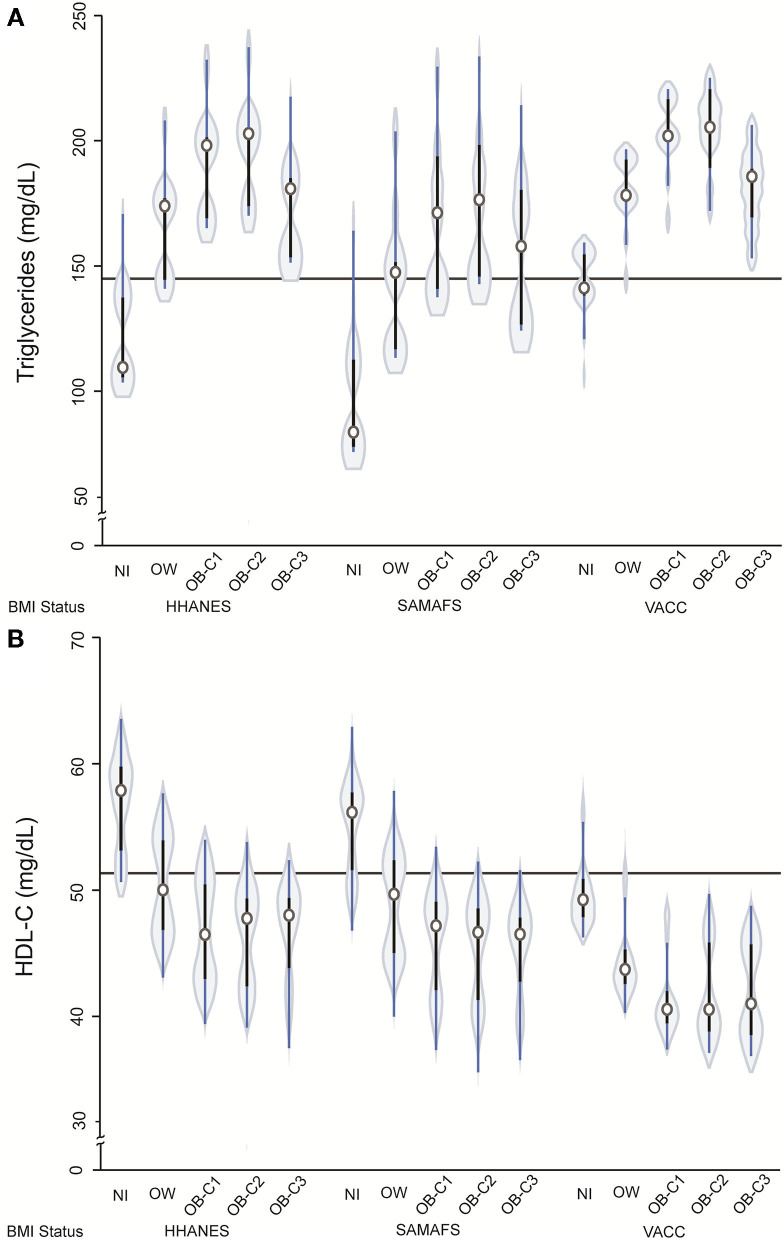
Figure 4.
Violin plots showing relationship between triglycerides (A) and HDL-C (B) with BMI categories after adjusting for age, sex, cohort, and T2D status. The presence of diabetes was associated with higher triglyceride concentration [b = 28.2 (se 12.3), p = 0.02] and lower HDL-C [b = −3.5 (se 0.9) p < 0.001]. The HDL-C showed interaction for VACC [b = 2.2 (se 1.1) p = 0.042]. HHANES: The Hispanic component of NHANES 2018 cohort; SAMAFS, San Antonio Mexican American Family Studies; VACC, Valley AIDS Council Cohort. NW, normal weight; OW, overweight; OB-C1, obesity-category 1; OB-C2, obesity-category 2; and OB-C3, obesity category 3. The continuous horizontal line represents the mean value without adjustment.

