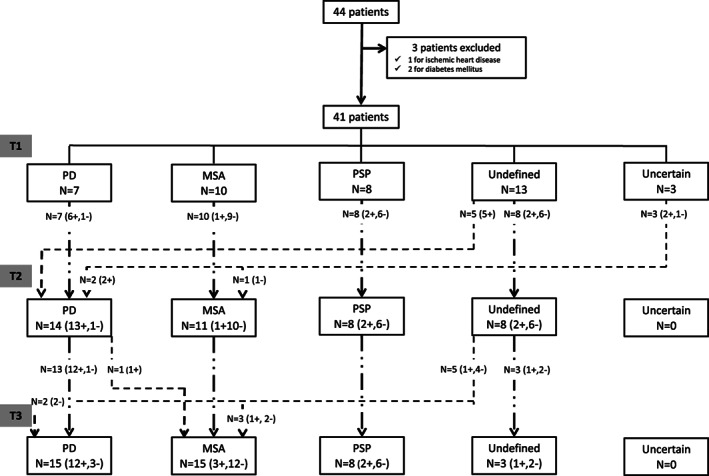
FIG. 1.

Flow chart resuming the patients' diagnosis at the three different time points (T1, T2, T3) of the study. (+: number of patients with pathological myocardial scintigraphy; −: number of patients with normal myocardial scintigraphy).

Flow chart resuming the patients' diagnosis at the three different time points (T1, T2, T3) of the study. (+: number of patients with pathological myocardial scintigraphy; −: number of patients with normal myocardial scintigraphy).