FIGURE 1.
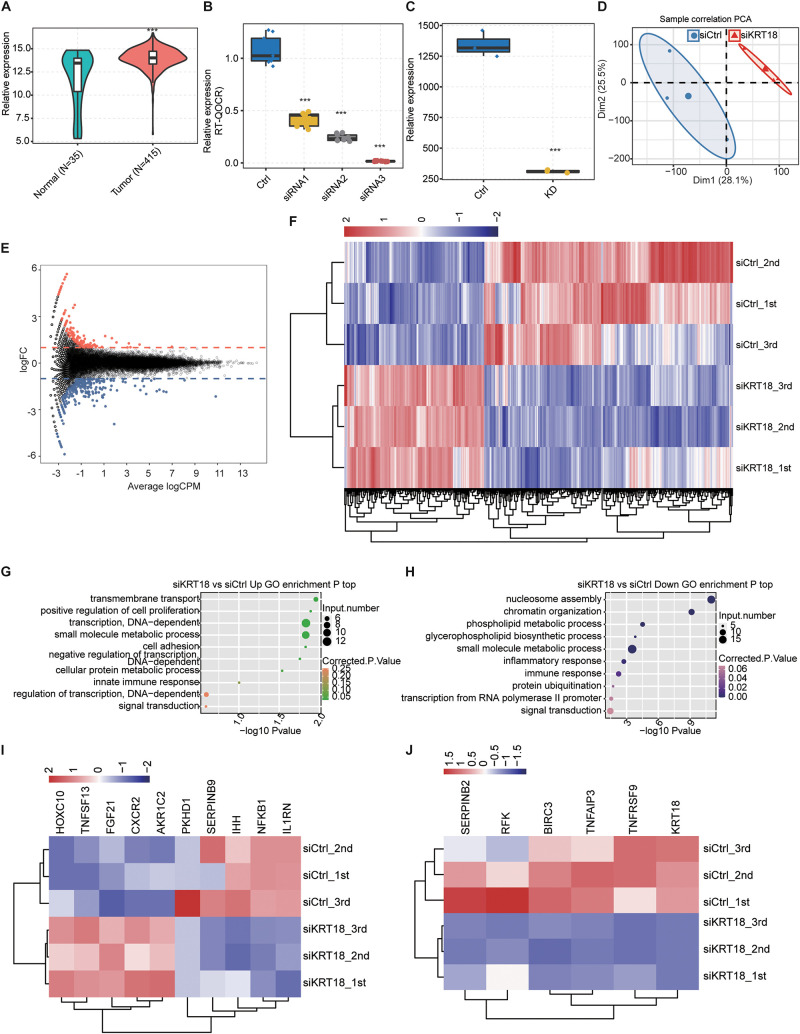
Overexpression of KRT18 in stomach adenocarcinoma (STAD) and RNA-seq analysis of KRT18-regulated transcriptome profile in AGS cells. (A) Overexpression of KRT18 in 450 stomach adenocarcinoma (STAD) samples from TCGA database, including 415 tumor tissue and 35 normal samples (para-carcinoma tissue). (B) KRT18 expression quantified by qRT-PCR after knocking down KRT18 in AGS cells using three siRNAs. (C) KRT18 expression quantified by RNA sequencing data of AGS cells treated with KRT18-siRNA2, FPKM values were calculated as explained in section “Materials and Methods.” Error bars represent mean ± SEM. ***p < 0.001, Student t-test. (D) Principal (F) (PCA) of KRT18-KD versus control AGS cells based on FPKM value of all expressed genes. The samples were grouped by KRT18-KD and control, and the ellipse for each group is the confidence ellipse. (E) MA plot shows KRT18-regulated genes identified in AGS cells. Up-regulated genes are labeled in red, whereas down-regulated genes are labeled in blue. (F) Hierarchical clustering of DEGs in KRT18-KD and controls. FPKM values are log2-transformed and then median-centered by each gene. (G,H) The top 10 representative GO biological processes of up- and down-regulated genes. (I) Heatmap presenting deregulation expression of cell proliferation or apoptosis genes in KRT18-KD AGS cells. (J) Heatmap presenting repressed expression of the other six apoptotic genes in KRT18-KD AGS cells.

