FIGURE 3.
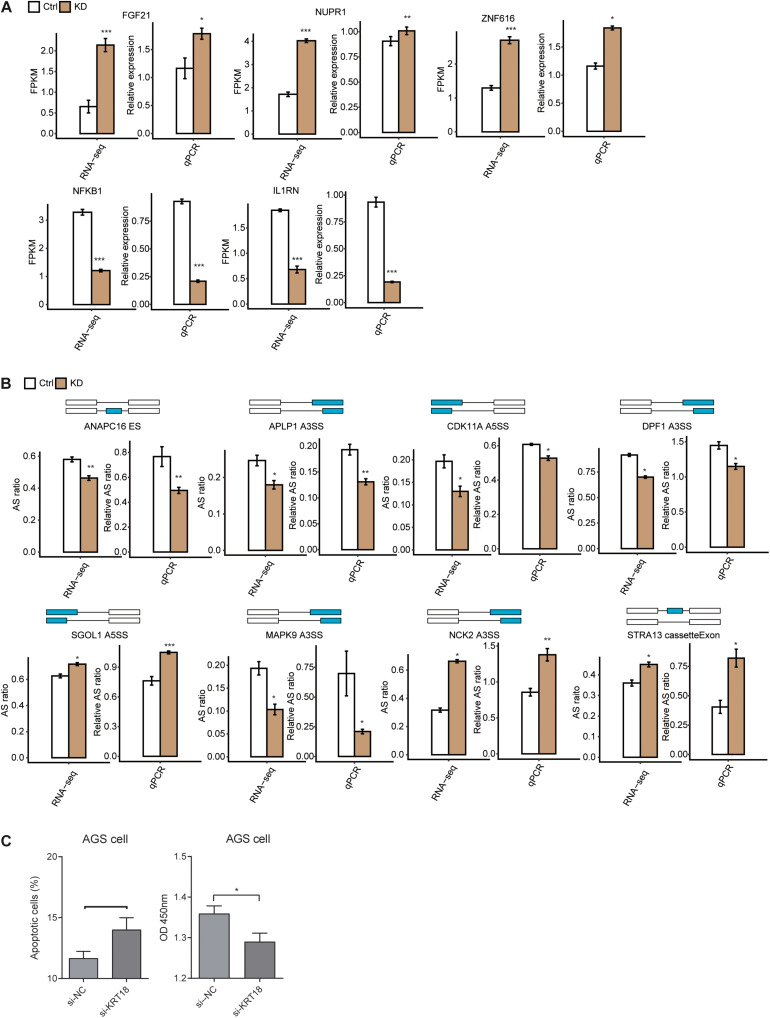
Validation of KRT18-affected expression and alternative splicing of genes related to cell proliferation and apoptosis in AGS cells. (A) Validation of KRT18-regulated gene expression by RT-qPCR in AGS cells. Gene expression quantified by RNA sequencing data and qRT-PCR. FPKM values were calculated as explained in section “Materials and Methods.” (B) Validation of KRT18-regulated alternative splicing events (RASEs) in genes related to cell cycle or apoptosis process by RT-qPCR in AGS cells. The schematic diagrams (top panel) depict the structures of ASEs, AS (altered splicing events), and M (model splicing events) (alternative exon was labeled in blue). The exon sequences are denoted by boxes and intron sequences by the horizontal line. RNA-seq quantification and RT-qPCR validation of ASEs are shown in the bottom panel. The altered ratios of AS events in RNA-seq were calculated using the formula: AS junction reads/(AS junction reads + M junction reads), whereas the altered ratios of AS events in RT-qPCR were calculated using the following formula: AS transcripts level/M transcripts level. Error bars represent mean ± SEM. *p < 0.05, **p < 0.01, ***p < 0.001, Student t-test. (C) Bar plot showing the apoptotic level (left panel) and proliferation level changes of AGS cells after KRT18-KD.

