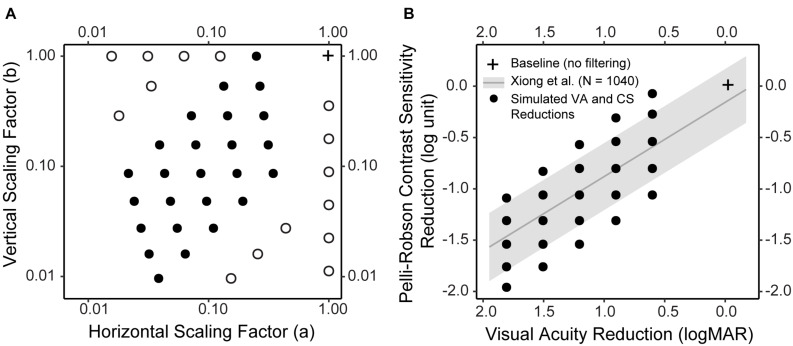
FIGURE 2.
Simulated low vision conditions. (A) The horizontal and vertical scaling factors of the forty simulated low vision conditions. Twenty-five conditions (solid dot) were determined so that the reductions in CS and VA would closely resemble the empirical distribution (see B for details). Fifteen conditions (empty dot) were boundary conditions. (B) The empirical distribution of CS reduction as a function of VA reduction, both compared to Age-adjusted normal baselines, in a large sample of subjects (N = 1,040) with various vision conditions (adapted from Xiong et al., 2020). The gray line represents the regression line, and the gray ribbon represents the 95% confidence interval around the regression line. The black solid dots represent the CS and VA reductions in the 25 simulations. Note that in B the VA axis was reversed, i.e., from large to small, to visualize the correspondence between A and B. In both figures, the cross represents the baseline condition without filtering.

