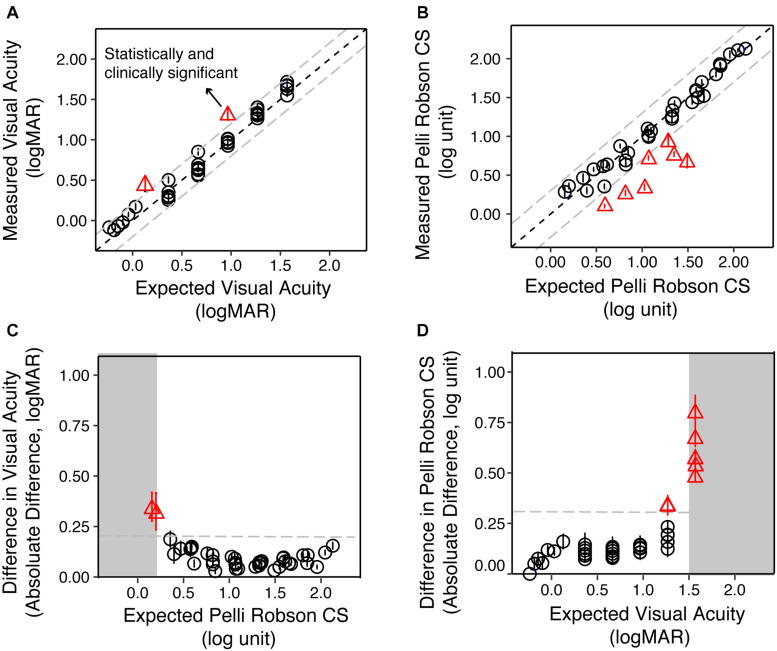
FIGURE 3.
The validity of simulating reduced contrast sensitivity and visual acuity in the Young Normal (YN) group. (A) The measured VA as a function of the expected VA. The circles represent the group average of each condition, and the error bars represent the standard errors. The red triangles represent conditions where the differences between the measured and expected values were statistically (p < 0.05) and clinically significant (>0.20 logMAR). (B) The measured CS as a function of the expected CS. The red triangles represented conditions where the differences between the measured and expected values were statistically (p < 0.05) and clinically significant (>0.30 log unit). (C) The difference between measured and expected VA as a function of the expected CS. When the expected CS was close to or worse than 0.15 log unit, the difference between measured and expected VA was the largest. (D) The difference between measured and expected CS value as a function of the expected VA. When the expected VA values were close to or exceeded 1.50 logMAR, the difference between measured and expected CS were the largest. In all four plots, the gray dashed lines represent the clinically significant difference in low vision (0.20 logMAR for VA and 0.30 log unit for CS), respectively.

