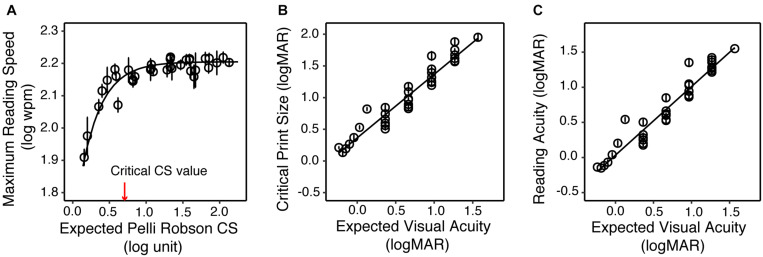
FIGURE 4.
The impact of simulated acuity and contrast sensitivity reduction on the reading performance of the YN group. (A) Maximum reading speed as a function of the expected CS. The red arrow represents the critical CS for a maximum reading speed of at least 90% of the maximum reading speed for normal vision (asymptote). (B) Critical print size as a function of the expected VA. (C) Reading acuity as a function of the expected VA. In all three plots the circles represent the group average of each simulated low vision condition, and the error bars represent standard errors.

