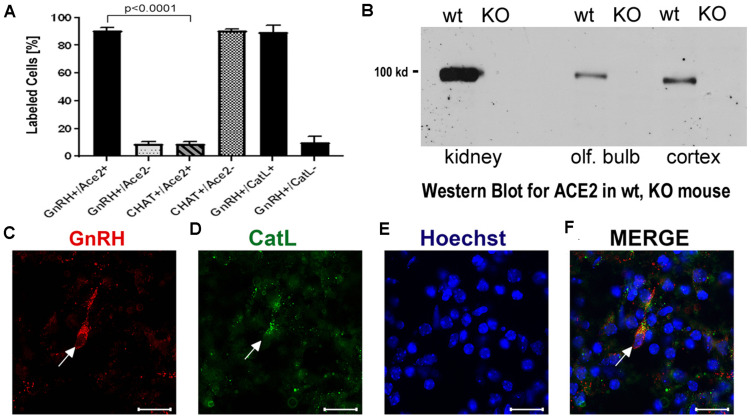
FIGURE 3.
(A–F) Quantification of neurons labeled with nervus terminalis markers, virus entry proteins, and verification of the specificity of the ACE2 antibody. (A) The large majority of GnRH-positive neurons is also ACE2-positive. In contrast, the majority of CHAT-positive (cholinergic) nervus terminalis neurons lack ACE2-expression. The total number of counted GnRH-positive or CHAT-positive neurons was set at 100%. Error bars represent ± SEM. A t-test shows that the colocalization difference between GnRH- and CHAT-positive nervus terminalis neurons is significant at p < 0.0001. For further details, see Supplementary Table 2. (B) Western blot of ACE2 in wildtype (wt) mice and in ACE2 knock-out (KO) mice. The first two lanes (kidney) were loaded with 25 μg total protein, the lanes for olfactory bulb and cerebral cortex were loaded with 60 μg total protein, and probed with the R&D ACE2 antibody. No ACE2 protein was detectable in the ACE2 KO mice, proving that the antibody indeed recognizes ACE2. (C–F) Example of GnRH-positive nervus terminalis neurons which are also cathepsin L-positive. (C) One GnRH-labeled neuron is marked with a white arrow. (D) The same neuron is labeled with the cathepsin L antibody (CatL, white arrow). (E) The cell nuclei are stained with Hoechst nuclear dye. (F) The three images are merged to show co-localization in the neuron indicated with the white arrow. All scale bars are 20 μm.

