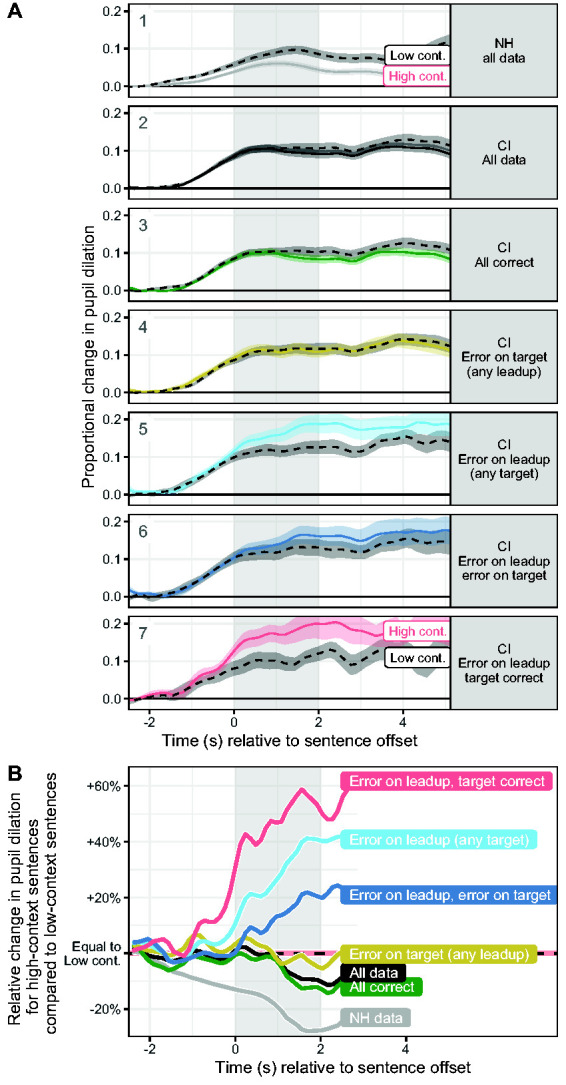
Figure 8.

Panel A: Changes in pupil dilation for high-context (solid colored lines) and low-context (dashed black lines) sentences, with various data subsets split into different panels. Error ribbons represent ±1 standard error. Target refers to the sentence-final word, and “leadup” refers to any of the words preceding the target. “Any {target/leadup}” means data were averaged over both correct and incorrect items. Panel B: difference between pupil dilation responses for high- and low-context sentences displayed in Panel A, expressed as proportional change of the high-context response relative to the peak dilation in the low-context response. Data below 0 represent reduction of pupil dilation for high-context relative to low-context stimuli, and data above 0 represent increased pupil dilation for high-context stimuli. In both panels, the gray shaded region indicated the 2 s of silence separating the end of the stimulus to the onset of the response prompt.
NH = normal hearing; CI = cochlear implant.
