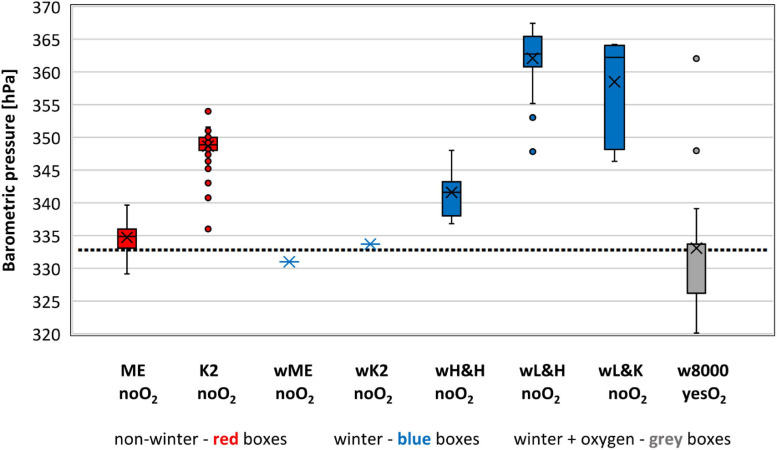
FIGURE 1.
Barometric pressure experienced on the summits we analyzed. Sample size – 499 ascents without oxygen support and 29 with oxygen support (1978–2021). Bars extend to the maximum and minimum BP, boxes span the 25th–75th percentiles, crosses inside the boxes mark mean values, horizontal lines inside the boxes represents median values, dots mark outliers, dotted line represents 10th percentile value of 333 hPa for all 499 ascents with no supplemental oxygen.

