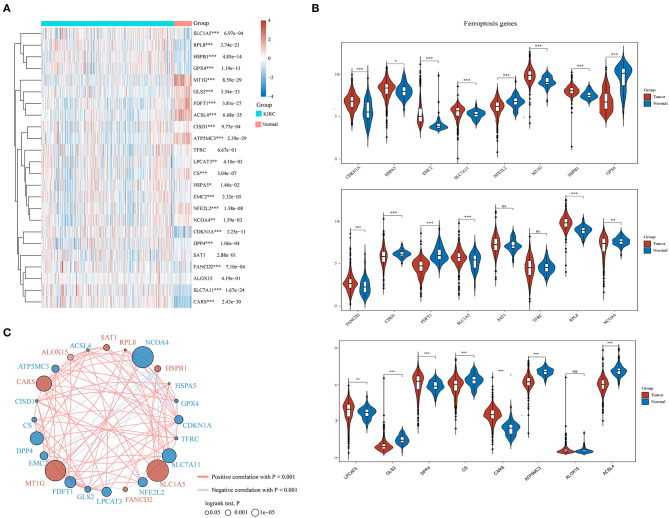
Figure 1.
The expression distribution, correlation, and prognostic values of ferroptosis regulators in clear cell renal cell carcinoma (ccRCC) patients. Heat map (A) and violin plots (B) of ferroptosis regulators in ccRCC compared to normal tissues. (C) Spearman correlation and prognostic values of ferroptosis regulators in ccRCC. The red and blue line respectively represents the positive and negative correlation. The red and blue dot represents bad and good prognosis, respectively. The larger the circle, the smaller the prognosis log rank p. *p < 0.05, **p < 0.01, and ***p < 0.001.

