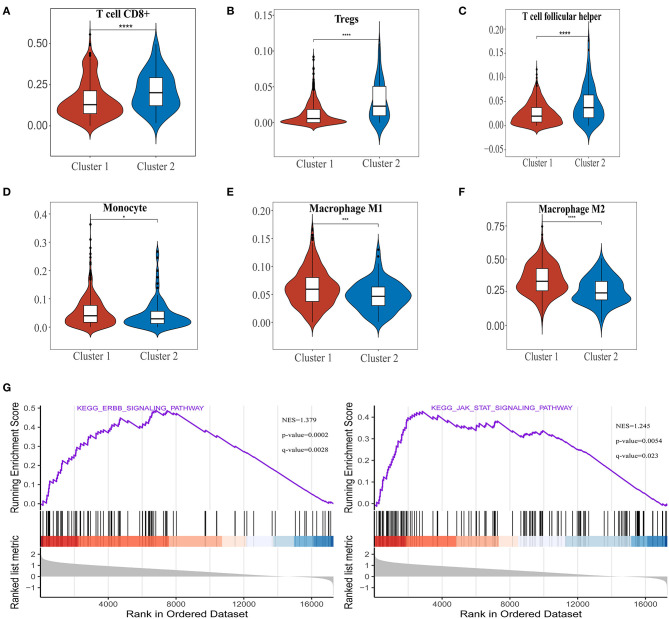
Figure 4.
The differences of immune cell infiltration levels in two clear cell renal cell carcinoma (ccRCC) subtypes. (A–F) The infiltration level of the CD8+ T cell (A), Tregs (B), and T follicular helper cell (C) were downregulated in cluster 1 ccRCC patients. The infiltration levels of the monocyte (D), M1 macrophage cell (E), and M2 macrophage cell (F) were upregulated in cluster 1 ccRCC patients. (G) Gene set enrichment analysis indicated that ERBB signaling and the JAK-STAT signaling pathways are significantly enriched in cluster 1. NES, normalized enrichment score; q-value, false discovery rate. *p < 0.05, ***p < 0.001, and ****p < 0.0001.

