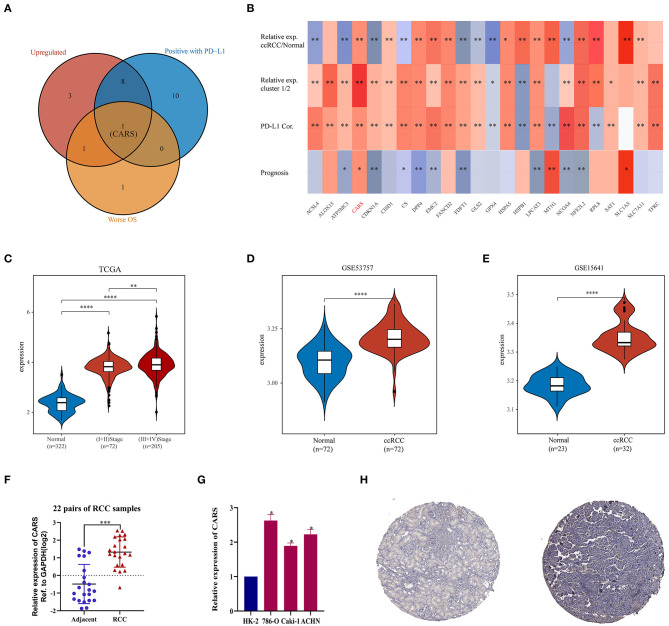
Figure 5.
Analysis of the CARS gene expression in ccRCC. (A) The Venn diagram suggested that the upregulation of CARS was an unfavorable prognostic factor and positively correlated with the PD-L1 expression in clear cell renal cell carcinoma (ccRCC). (B) The heat map visualized the relative expression of 24 ferroptosis regulators in ccRCC/normal (row 1) and cluster 1/2 (row 2) and the correlations of 24 regulators with the PD-L1 expression (row 3) and prognosis (row 4). The red color indicates a high expression in ccRCC or cluster 1, positively correlated with PD-L1 or bad prognosis. *p < 0.05 and **p < 0.01. (C) CARS was upregulated in ccRCC tissues compared to normal tissues, and the expression significantly correlated with AJCC stages. (D,E) Validation sets showed that CARS was highly expressed in ccRCC tissues compared to adjacent normal tissues in GSE53757 (D) and GSE156417 (E). (F) Relative expression of CARS was detected by qRT-PCR in 22 pairs of ccRCC and normal tissues. (G) Compared with HK-2 cell line (normal), CARS was highly expressed in 786-O, ACHN, and caki-1 cell lines (ccRCC). (H) Immunohistochemistry staining indicated that, compared with normal kidney tissue (left), CARS was significantly elevated in ccRCC tissue (right) in the human protein atlas (antibody HPA002384, ×10). *p < 0.05, **p < 0.01, ***p < 0.001, and ****p < 0.0001.

