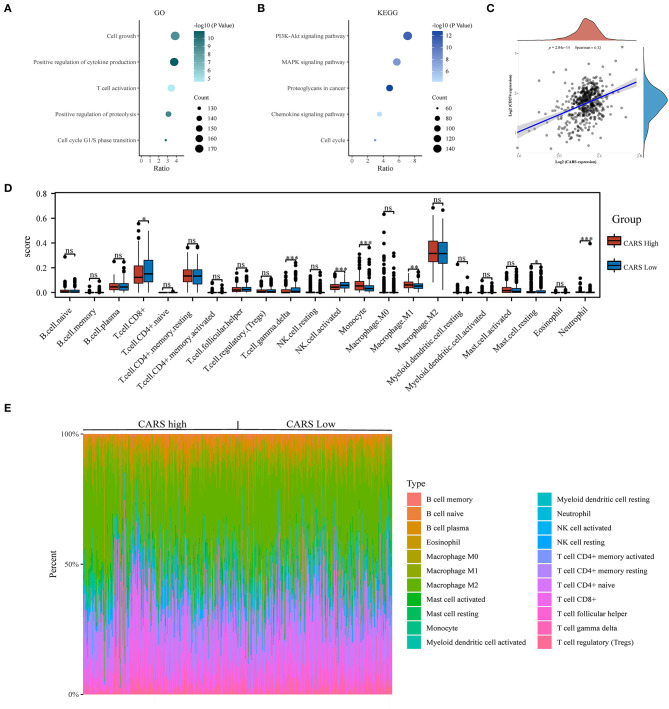
Figure 7.
Correlation analysis of CARS expression with PD-L1 and infiltrating immune cells in clear cell renal cell carcinoma (ccRCC). (A,B) The enriched Gene Ontology (A) and Kyoto Encyclopedia of Genes and Genomes signaling pathways (B) analysis of highly expressed CARS in ccRCC. (C) Spearman correlation analysis of CARS expression and PD-L1 expression in ccRCC. (D) The infiltrating levels of immune cells in high and low CARS expression groups in ccRCC patients. (E) The heat map visualized the percentage abundance of tumor-infiltrating immune cells in each sample. *p < 0.05, **p < 0.01, and ***p < 0.001.

