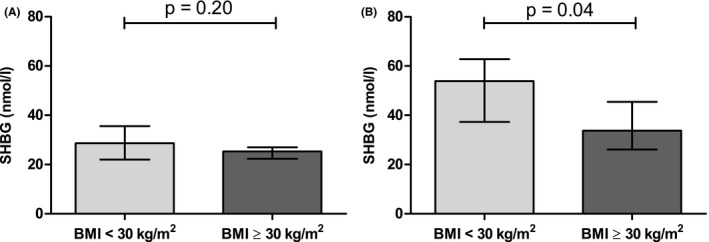
FIGURE 2.

Sex hormone binding globulin (SHBG) levels in obese (body mass index [BMI] ≥30 kg/m2) and non‐obese (BMI <30 kg/m2) men (A) and women (B). Data are expressed as median with interquartile range. Differences between groups were analysed with linear regression analyses, adjusted for study population
