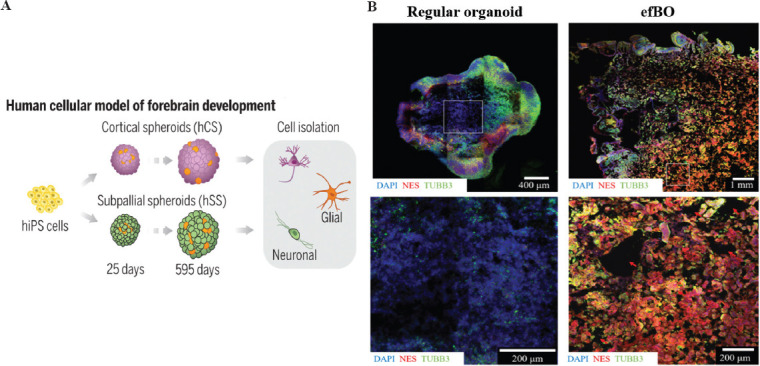
Figure 7.

(A) Schematic representation of the flow of human induced PSCs developing into forebrain cells. (B) Comparison of tissue core between regular brain organoids and efBOs. Immunohistochemical staining of NES and TUBB3 was performed to visualize cells. DAPI was used as counterstain. (Adapted with permission from Trevino AE, et al., Science, 367: eaay1645, Copyright 2020, The American Association for the Advancement of Science[72]) and (Adapted with permission from Theresa S P Rothenbücher et al., Biofabrication, 2021,13 011001, IOP Publishing Ltd[76]).
