
Figure 2.
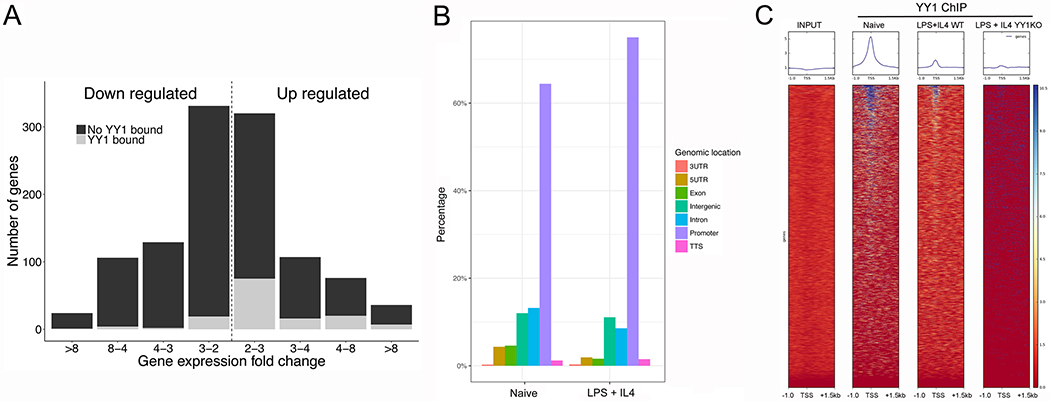
YY1 predominately binds to promoters in murine splenic B cells. (A) YY1 binding is plotted in relation to change in expression levels after YY1 knockout and whether YY1 bound to promoter regions (gray shading) or had no YY1 binding (black shading). (B) YY1 Chip-seq data are plotted according to binding site locations within the genome. (C). YY1 localization is plotted in the 2.5 kb region surrounding known promoters. Data are representative of three independent ChIP-seq experiments. The input lane is DNA from naïve splenic B cells.