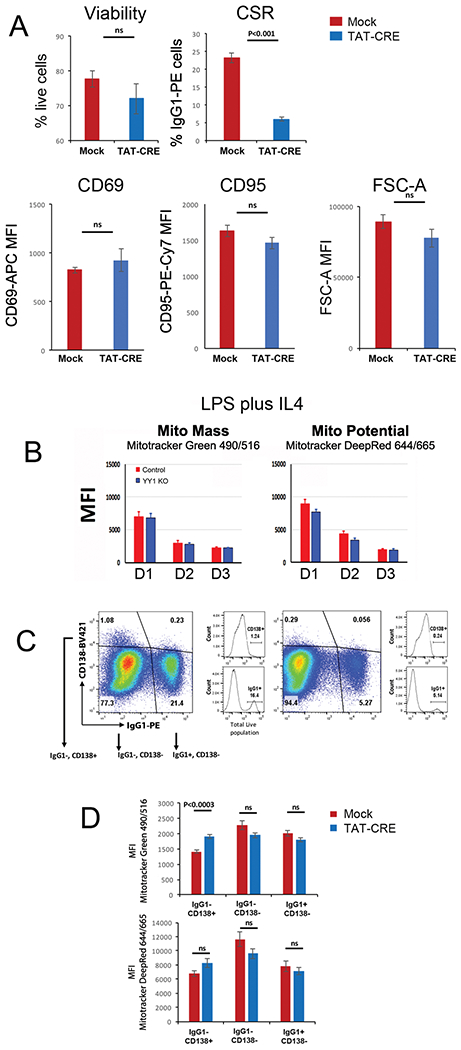
Figure 4.

YY1 knockout does not impact mitochondrial mass or potential at day 3. Splenic B cells from yy1f/f mice were either mock treated (red bars) or treated with recombinant TAT-CRE protein to delete the yy1 gene (blue bars). Cells were stimulated with LPS plus IL4 for 3 days. (A) Percentage of live cells was evaluated by Zombie Aqua™ dye or DAPI, and percent CSR to IgG1 was determined by flow cytometry with anti-IgG1 antibody. Experiments are from 15 independent experiments with one mouse per experiment and statistical significance was determined by a two-tailed Student’s t-test. Levels of CD69 and CD95 were determined by flow cytometry with anti-CD69 and anti-CD95 antibodies. Experiments are from three experiments and statistical significance was determined by a two-tailed Student’s t-test. (B) Cells were evaluated for mitochondrial mass or potential by flow cytometry analysis with MitoTracker red or green, respectively, on days 1, 2, or 3. None of the changes reached statistical significance. Data are from four independent experiments with two animals per experiment. (C and D) On day 3, cells were evaluated by flow cytometry for IgG1 and CD138 expression, and cells in IgG1− CD138+, IgG1− CD138−, or IgG1+ CD138− fractions were evaluated for mitochondrial mass and potential by flow cytometry using MitoTracker green or red. The CD138− populations in (C) and (D) are a combination of CD138 intermediate and low cells. Thus, IgG1− CD138+ cells in the upper left quadrant of panel (C) are analyzed in (D); the IgG1− and CD138− cells in the lower left quadrant of (C) are analyzed in (D), and the IgG1+ CD138− cells in the lower right quadrant in (C) are analyzed in (D). Mitotracker DeepRed falls under the APC channel (644/665 exc/emi) and Mitotracker Green falls under the FITC channel (490/516; exc/emi). Results are from three independent experiments with two mice per experiment. Shown are the mean and standard deviation. Statistical significance was determined by a two-tailed Student’s t-test.
