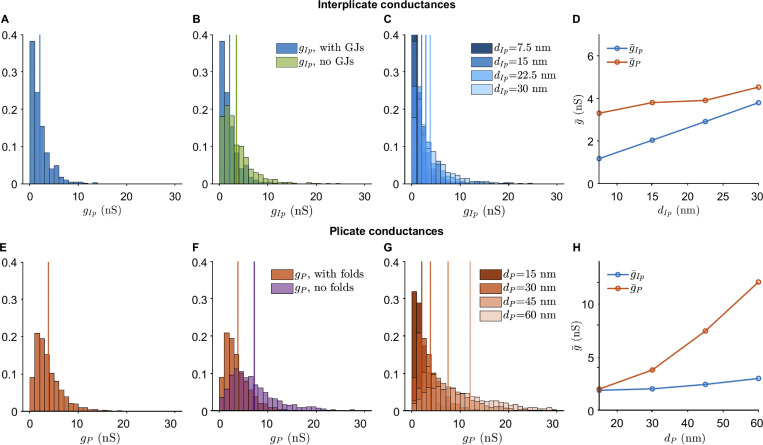
Figure 5.
Interplicate and plicate region conductances.(A) Distribution of conductances in the interplicate region (gIp), with values from the five meshes in Fig. 4. (B) Interplicate conductances in the presence and absence of GJs. (C) Interplicate conductance distributions for increasing interplicate intermembrane distance dIP. (D) Mean interplicate conductance (gIp) and mean plicate conductance (gP) are shown as a function of dIp. Note that the blue line values correspond to the vertical lines in C. (E) Distribution of conductances in the plicate region (gP), with values from the five meshes in Fig. 4. (F) Plicate conductances in the presence and absence of plicate folds. (G) Plicate conductance distributions for increasing plicate intermembrane distance dP. (H) gIp and gP are shown as a function of dP. Note that the orange line values correspond to the vertical lines in G. In A–C and E–G, vertical lines denote distribution means. Parameters: A–D, dP = 30 nm; E–H, dIp = 15 nm.

