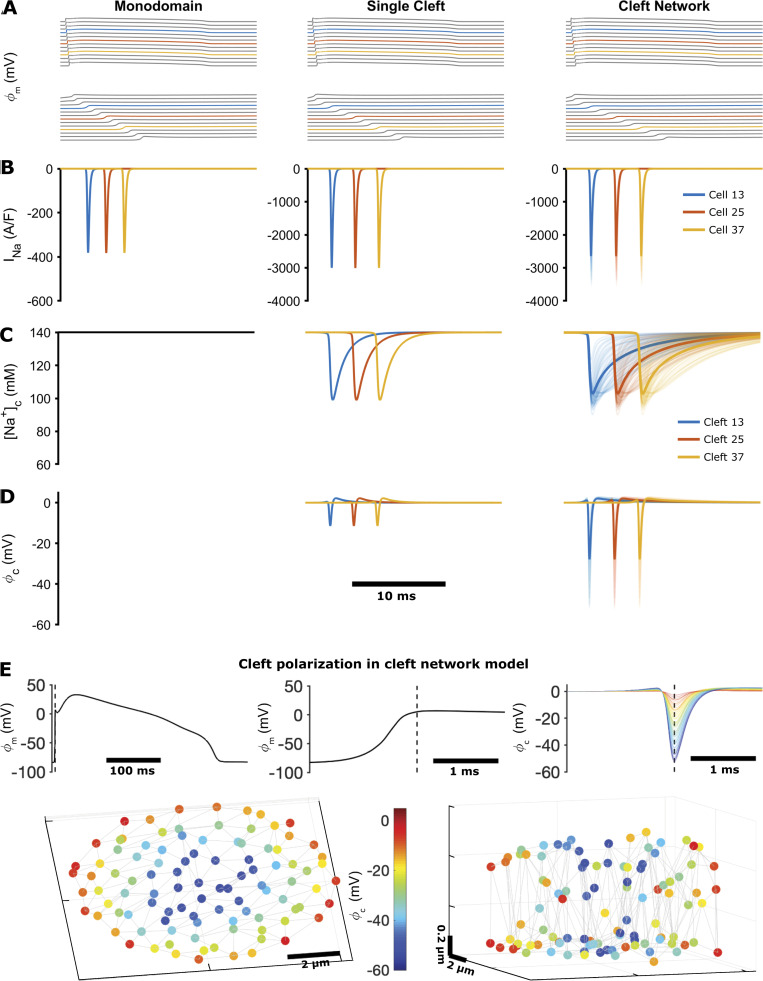
Figure 6.
Simulation of conduction in cardiac tissue models, comparing the monodomain model, the single-cleft model, and the FEM-derived cleft network model.(A) Axial membrane transmembrane potential (ϕm), illustrating a propagating electrical wave (top) and a magnified view of the action potential upstroke (bottom). (B) Na+ current (INa) on the axial membrane (monodomain model) or at the ID (single- and network-cleft models). (C) [Na+] in the intercellular cleft. The monodomain model does not account for dynamic [Na+] or voltage in the cleft. [Na+] values in all cleft compartments are shown for the cleft network model, with the average shown by the thicker line. (D) Cleft potential (ϕc) in the single-cleft and network-cleft models, with all compartment potentials and average (thick lines) shown for the cleft network model. In A–D, colored lines represent cell or cleft 13 (blue), 25 (orange), and 37 (yellow) in the 50-cell tissue. (E) Cleft voltage hyperpolarization in the cleft network model. Top: Axial transmembrane potential ϕm and cleft potential ϕc for cell or cleft 25 are shown, with the dashed line indicating the time of maximum cleft hyperpolarization. Bottom: Color indicates the cleft hyperpolarization at each node in the cleft, with node position indicating the location in the 3-D cleft space (shown from two views). Parameters: single cleft, d = 15 nm; cleft network, M = 100, dP = 30 nm, dIp = 15 nm.

